Update: Analysis of 2024 Traffic Crashes In Falls Church City
By Andrew Olesen
Falls Church continues to see high numbers of traffic-related injuries, with 175 reported in 2024—making it the third-worst year in the last eight. A new analysis of city crash data highlights that nearly all injuries occur on key 25-30 mph cut-through roads, and the first traffic fatality since 2010 underscores the urgent need for proven safety improvements.
The full report on 2024 road injuries, which includes findings on pedestrian and bicycle safety, is available on the Bike Falls Church blog here: High Number of People Still Getting Hurt on Falls Church Roads in 2024.
When sharing this report with the Falls Church Police Department, they acknowledged the importance of data-driven decision-making and emphasized their commitment to transparency and using crash and crime data to guide City safety strategies. Police Chief Shahram Fard plans to continue the practice, started this year, of providing City Council with a periodic update.
CACT Analysis of Traffic Crashes In Falls Church City
By Andrew Olesen, former CACT Vice Chair (served 2021-2024)
Published May 17, 2024.
Summary
- Last year, injuries on our roads jumped by a whopping 50% compared to 2022.
- Pedestrian injuries skyrocketed by 166%, while bicyclist injuries increased by 57% compared to their seven-year average.
- Car occupants weren’t spared either, with 203 reported injuries in just 10 months, far surpassing the previous full-year peak of 161 injuries back in 2017.
- Most concerning? At least 22 pedestrians found themselves injured in 2023, shattering the previous record of 14 in 2021.
- Our injury rate, per mile traveled or per capita, exceeds Alexandria, Fairfax County, Fairfax City, and Fairfax County and is 200% higher than Arlington’s.
- Fatalities are rare because of our small size but do happen every 10 years – and the people we lose are always walking or biking, and are often seniors or children.
Background
This is an analysis of reportable traffic crashes (involving injury or significant property damage) in the Virginia Department of Motor Vehicles Traffic Records Electronic Data System (TREDS) and Falls Church City Police Department records of bicycle incidents. It updates a 2021 analysis (overall and pedestrian-focused) by former Citizens Advisory Committee on Transportation (CACT) Chair Paul Baldino. This analysis was presented to the CACT at the beginning of 2024.
2023 is a record year for traffic crashes
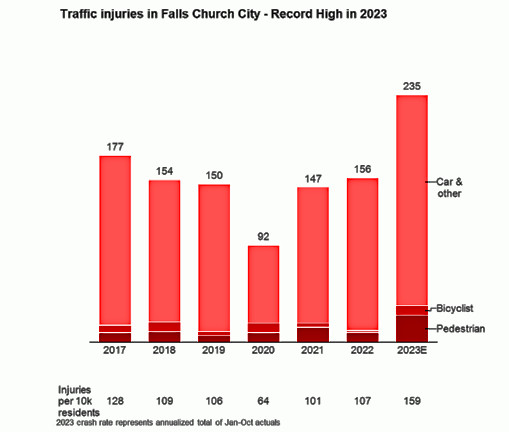
There were 50% more roadway injuries in 2023 than 2022, reversing the downward trend from 2017-2019. Pedestrian injuries are up 166% and bicyclist injuries are up 57% versus their 7-year average. Car occupant injuries totaled 203 in just 10 months of 2023, which greatly exceeds the previous full-year peak of 161 injuries in 2017. Meanwhile, at least 22 pedestrians were injured in 2023, greatly exceeding the full-year peak of 14 in 2021.
Falls Church City is more dangerous than our neighbors
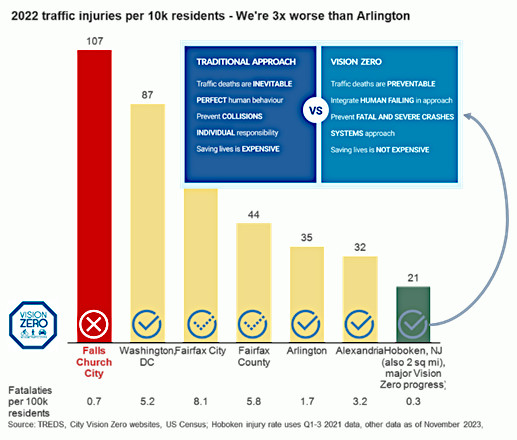
Our injury rate, per mile traveled or per capita, remains much higher than neighboring jurisdictions. Arlington, Alexandria, Fairfax County, Fairfax City, and Fairfax County crash rates have not exceeded pre-COVID levels while ours has. Our injury rate per capita is 200% higher than Arlington’s.
Traffic fatalities here are rare (given our size) but about 1 person dies every 10 years. A senior citizen was killed in April 2024. The majority of fatalities have been pedestrians or bicyclists, and either children or elderly. Fewer of our injuries become fatalities than in neighboring jurisdictions, but our rate exceeds Hoboken, NJ which is also 2 square miles in size and has deployed Vision Zero techniques to eliminate road fatalities and massively cut injuries.
Why Are Injuries Increasing and Why are Injuries Per Capita Higher in Falls Church?
The rest of this report sticks to facts or to recommendations that experts can take under consideration. The cause-and-effect is a more complicated question, both locally and nationally, but we offer here a simple and highly probable rationale. Since COVID injuries have been increasing nationwide, especially for bicyclists and pedestrians. Likely reasons for the increasing number of crashes are:
- Cars are getting taller, heavier, and faster – which makes crashes both more likely and more severe.
- Cell phones and in-car screens have become more ubiquitous, tempting everyone on the road with distractions.
- Drivers (people?) have become less courteous since COVID, it’s unclear exactly why.
- People are out and about again after COVID, so all else equal we should see an increase in the number of crashes back to a pre-COVID level.
- Falls Church is becoming denser with more residents and more destinations and is getting better sidewalks and better bike paths – that likely means more people on foot and on bike and thus more of them getting hit by cars (until we reach a threshold level for “safety in numbers” or improve the bike/walk facilities on busy roads).
The higher rate of injuries vs. our neighbors holds whether you look at injuries per capita or per vehicle mile traveled. The simplest explanation is the “Vision Zero” checkmarks in the chart above. Hoboken, NJ has taken traffic safety extremely seriously, collecting data to understand their risks (like the data in this report) and implementing quick, low-cost changes to make things safer. Our neighboring jurisdictions have done similar things but to a lesser extent.
Falls Church roads, however, look almost unchanged between 2019 and 2023. The Neighborhood Traffic Calming projects that have happened weren’t in high crash areas. There are many improvements coming (e.g., pedestrian crossing signals on Broad Street, multi-modal improvements on Broad Street, W&OD trail crossings) but they aren’t here yet and some won’t happen for half a decade or more.
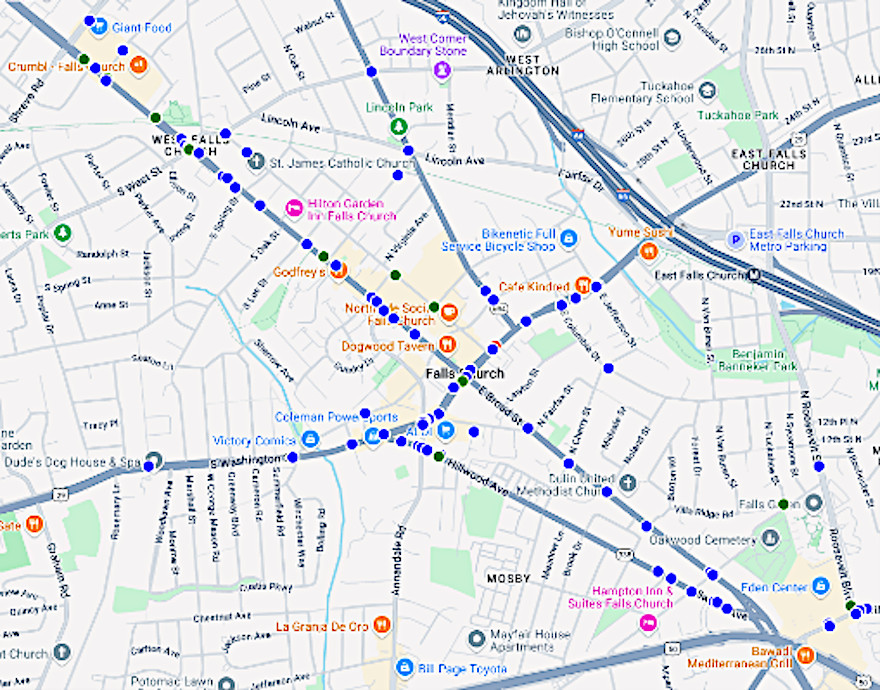
Where? It’s Broad and Washington
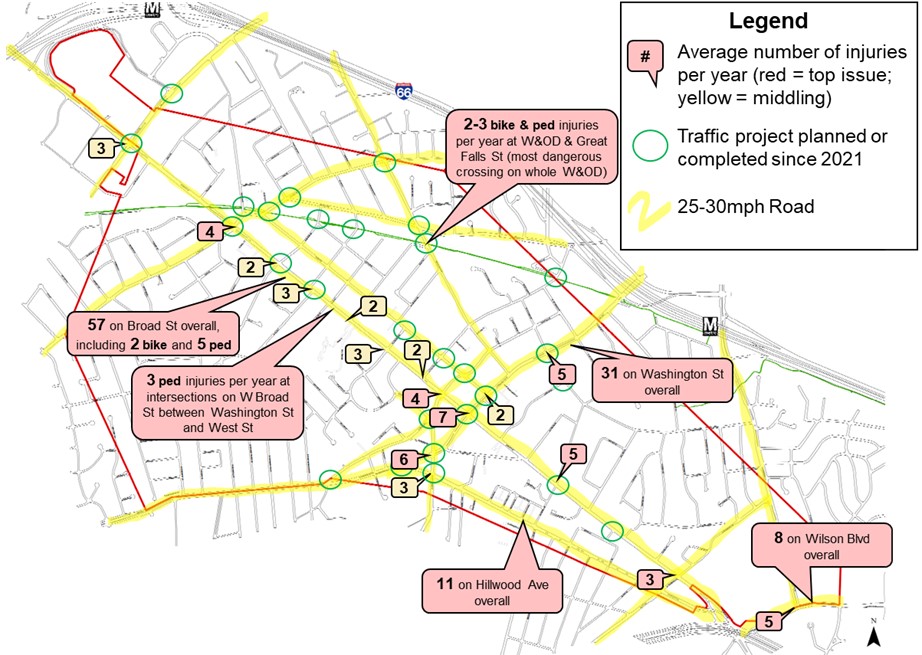
About 65% of all injuries occur on Broad or Washington Streets, consistent across cars, bicycles, and pedestrians (when excluding the W&OD for bicycles). Busy crossroads with these two streets are hotspots, e.g., crossings of Broad St by Cherry, Washington, Maple, Virginia, Oak, West, and Haycock. Crossings of Washington by Columbia, Park, Annandale. Another hotspot is Wilson Blvd and N Roosevelt Blvd, at Eden Center. Kids were involved in 50% of bicyclist crashes on Broad Street. Crashes with children are more common closer to the High School. About 25% of pedestrian injuries have occurred on Broad Street “downtown” between N West Street and Washington Street. Fatalities have been on Broad Street, Washington Street, and W&OD crossings.
Next highest injury roads are Hillwood Avenue, Wilson Boulevard, and Maple Avenue (16% of injuries). These roads have a 25 mph speed limit. Only 7% of injuries occurred on roads now signed 20mph, many at intersections with 25-30mph roads.
W&OD Trail injuries
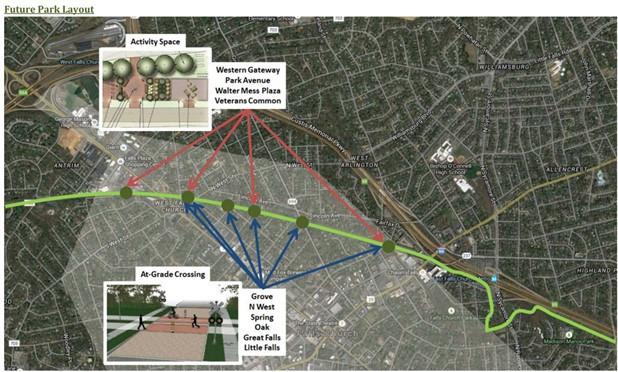
For our cycling friends, the W&OD Trail is where most injuries occur, almost exclusively at the road crossings. About 30% of all bicycle crashes occur where the W&OD Trail crosses roads. The crossing at Great Falls St is the most dangerous road crossing on the entire W&OD with more than 2 injuries per year and one fatality in 2002 (per TREDS).
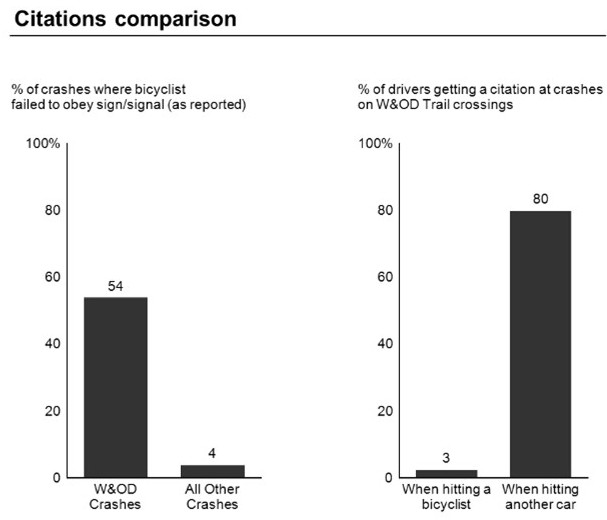
Police data show that failure to obey a traffic signal (stop sign) is a cause in at least 54% of 39 bicycle crashes on the W&OD and just 4% elsewhere – if the issue were “scofflaw bicyclists” then these numbers should not be so different. A car driver was only cited in one of those incidents. There were five car-car incidents at a trail crossing, typically a car rear-ending another car (likely when the driver ahead slowed or stopped to look for people walking and biking). Four of those drivers (80%) received citations.
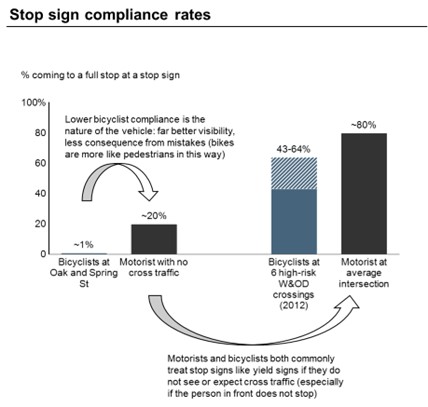
There is a design problem. Stop compliance on the Oak and Spring Streets crossings is just 2% (observation of 100 bicyclists in summer 2023). W&OD stop signs do not “command respect” per the Manual for Uniform Traffic Control Devices. This issue is discussed more fully in Rethinking Intersections on the W&OD Trail in Falls Church. Surges in police enforcement of the trail stop signs has not changed the bicyclist injury or compliance rate. The confusion, caused by the design, results in those rear-ending crashes between cars. Hopefully the re-engineering of those, with construction currently underway, will solve some of these problems. (Read W&OD Trail Crossings – Construction Begins April 2024.)
Contributing factors to road accidents
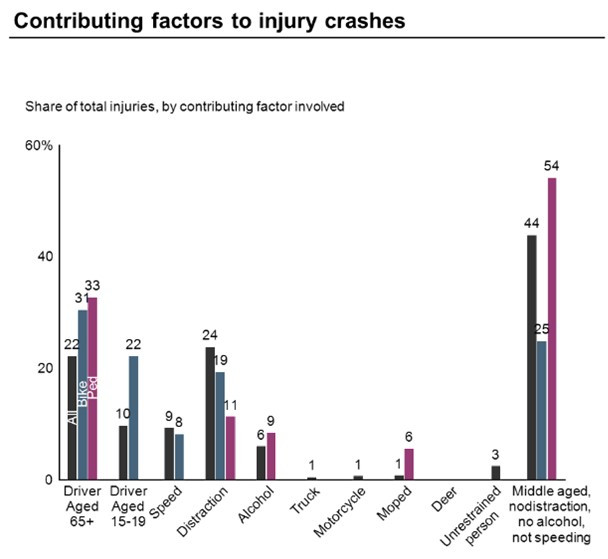
The chart above shows factors that listed in the Police data as a contributing factor of the traffic crash.
- Distractions, including cell phones, factor into 24% of all injuries.
- Teen drivers are implicated in 10% of all injuries but account for 22% of those involving bicyclists.
- Our senior drivers, meanwhile, are involved 22% of all injuries but account for 31% of bicyclist injuries and 33% of pedestrian injuries.
- Although less frequent, alcohol and speed are still culprits in about 9% of injuries each.
Nationwide the youngest and oldest drivers cause more than their fair share of accidents but what is surprising about the finding above is that in Falls Church they are even more over-represented in crashes with people walking and biking. The other interesting takeaway is that that most injuries are caused by middled aged, undistracted, sober, speed-limit obeying drivers. This speaks to the principles of Vision Zero – that people make mistakes, even well-meaning ones with decades of experience and in prime health.
Recommendations for a safer Falls Church
- Broad & Washington Infrastructure improvements
- Make all intersections in the City “no right on red” – right on red was made legal in the 1970s oil crisis as a fuel-saving measure, now more fuel-efficient but heavier cars cut counter to the original thinking on trading off between fuel and safety.
- Add leading pedestrian intervals (pedestrians get a head start before the light turns green) and remove “beg buttons” (the button pedestrians press to request a walk signal) so that pedestrian signals always activate or, if that isn’t feasible, time them to reduce pedestrian delay and improve compliance (nationwide, often these buttons don’t work or can take more than one light cycle to show a walk signal). Coming improved pedestrian crossings will help too.
- Increase automated red light and speeding enforcement.
- Time/coordinate lights to control traffic speeds (similar to US-1 in Old Town Alexandria).
- Lower speed limits to 25mph.
- Evaluate Road Diets on E Broad St and Annandale Road, and provide comfortable bike/pedestrian alternatives on parallel streets like Park Ave, Annandale Road, Little Falls, and Maple.
- Rethink Other 25mph Roads
Maybe it’s time to shift our focus from quieter 20mph neighborhood streets (“Neighborhood Traffic Calming“) to the busy roads where most injuries occur, like Wilson Blvd and Annandale Road. ,Evaluate Road Diets on E Broad St and Annandale Road, and provide comfortable bike/pedestrian alternatives on parallel streets like Park Ave, Annandale Road, Little Falls, and Maple. - Increase use of Roundabouts
Neighborhood, mini, and standard size to improve safety & cut maintenance cost. Roundabouts are well-proven to be safer for drivers and pedestrians by lowering speeds, simplifying the number of things to watch out for, and replacing T-bone collisions with less severe side-swipes. - Better W&OD Intersections
- At those tricky trail crossings, we could improve the signage to make behavior more predictable. The new crosswalks will help too, but something needs to be done about the complex intersection at N West St (where a senior citizen was hit while riding a bike in May 2024, by a driver turning right across the crosswalk).
- Add stop signs for cars on all road crossings where local drivers typically stop to look for trail traffic already, including Great Falls St, consistent with signage in Herndon.
- Consider removing trail stop signs where they do not command respect or fulfill a need, in collaboration with NOVA Parks and consistent with the action taken in Rock Creek Park (NPS), Alexandria, and Montgomery County. Consider replacing them with caution signs and/or add stop signs on roads.
- Teen and Senior Citizen Education
Update Driver’s Ed to ensure that driving safety around bicycle is part of our teenagers’ curriculum. Offer “driver” and “bicycling for seniors” education to Senior Citizens via the Community Center and age 55+ communities. Continue to improve walkability and bikeability to give senior citizens an alternative to driving. Conduct regular safety marketing outreach to drivers, bicyclists, and pedestrians. - Bicycle Education
Add Bicycle Education to the Oak Street Elementary curriculum consistent with the practices in Alexandria, Arlington, and DC and Bicycle Friendly Community criteria. Offer bike education in Rec & Parks. - Follow Vision Zero and Use Data
Reports on traffic safety data (and performance vs. our transportation goals in general) should be published by the City, not private citizens. Using the principles of Vision Zero, the City can convene the cross-section of stakeholders needed to follow that data to rapidly implement safety improvements with the best return on investment and build safe design into larger and longer-term projects.
Note: Review and input was requested from the Police Department on 21 Nov 2023. None was provided as of 11 Jan 2024.
Appendix: Bicycle Data Deep Dive
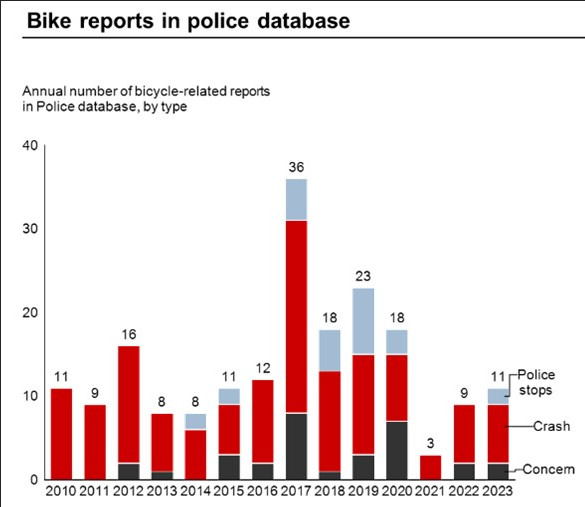
Process: To enable a more data-based approach to the 2024 Bicycle Master Plan and general bicycle advocacy, I asked Chief Gavin for all Police Department data on incidents involving bicycles. This includes reportable crashes as above, but goes deeper into every tracked encounter, including non-reportable crashes (no injuries or significant property damage), calls/complaints, near miss sightings, and some warnings/tickets. The data included 193 entries from 2010 through July 2023. Free-text location and comments from the Police were coded to enable this analysis.
- A review of all Police data on bicycle incidents (reportable crashes and otherwise) shows a similar trend to TREDS data: most crashes with people on bicycles occur at W&OD road crossings and along Broad and Washington.
- The City’s exploration of adding road stop signs to the W&OD and plans to improve the crosswalks should improve crashes along the W&OD. Continued attention to crash data following improvements (e.g., signalization of N West St) is needed to ensure effectiveness.
- New signals planned along Broad and Washington should help, but this will likely not be enough as riders must contend with turning traffic, driveways, using narrow/obstructed sidewalks as an alternative to a dangerous road. We can and should do more for bike and ped safety on our major roads – parking on weekends & overnight, adding leading pedestrian intervals (pedestrians get a few seconds to walk before the lights turn green), removing beg buttons (i.e., pedestrian-activated buttons to get a WALK signal) – or at least review the pedestrian delay incurred by those buttons and retime them, making all intersections no turn on red, increasing automated red light and speeding enforcement, providing comfortable alternatives on streets like Park Ave, and timing/coordinating lights to control traffic speeds (like US-1 in Old Town Alexandria).
- 50% of reports involving juvenile bicyclists were on Broad St and none were on the W&OD – making our roads safer for bicyclist means making our City safer for kids.
- W&OD trail stop signs play an outsized role in the data
- Unpredictable driver and bicyclist behavior results in continued car-bicycle and car-car crashes at these intersections. Police enforcement surges have not changed this.
- When a driver hits a bicyclist on the W&OD, the police almost always fault the bicyclist – only 1 in 39 car-bicycle crashes involved a citation for the driver. When drivers at these intersections hit other cars, they almost always get a citation.
- This is a design issue, not one of lawless bicyclists. Bicyclist failure to obey traffic control devices was cited in 54% of crashes along the W&OD and 2% of crashes elsewhere. If bicyclists lawlessly ignored all road signs, these number should be much more similar.
- In a separate analysis of W&OD crossings, TREDS data shows that the crossing of Great Falls St is now the single most dangerous crossing on the entire trail, by a healthy margin.
- There are a number of emotional issues that end up being very minor in the data, e.g., complaints from the public about bicyclists, doorings (people open car doors into the path of an oncoming bicycle), bicycle-pedestrian crashes, and altercations involving bicyclists. More can be done to reduce all these undesirable events, and certainly not all are reported to the police, but they pale in comparison to car-bicycle crashes.
- Detailed figures and findings:
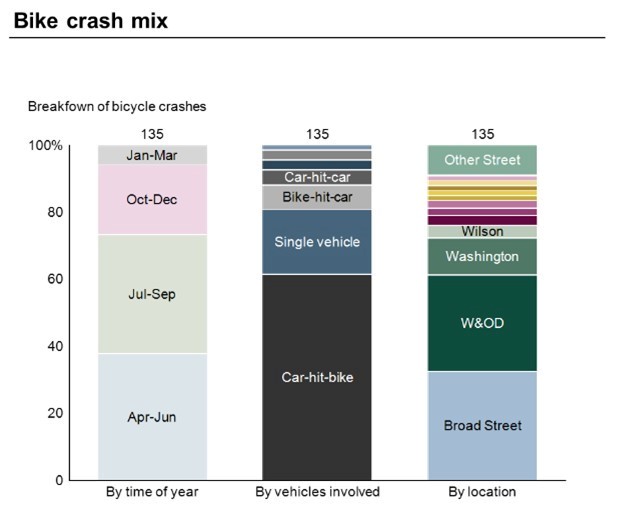
- The Police log an average 13.8 reports per year involving bicycles or scooters and see 5.6 reportable injuries of bicyclists per year. 70% of reports involving crashes occurred in Q2 and Q3 (April-September). Overall reports peaked in 2017-2019 and have declined since. Reports of crashes specifically see no trend over time but were highest in 2017.
- Key areas of concern are the W&OD trail (29% of reports involving crashes), Broad Street (33%), and Washington St (11%) which is consistent with TREDS reportable crashes for bicyclists and pedestrians. After these top 3 there is a long tail (e.g., Wilson Blvd 4%, Great Falls St 3%, Columbia St 2%, Hillwood Ave 3%).
- Bicyclist failure to obey stop signs or other traffic control devices was cited in 54% of crashes along the W&OD and 2% of crashes elsewhere. The other crashes on the W&OD that did not mention stop signs were still mostly at the crossings and were simply silent on the issue of signage (a few crashes were bikes swerving to avoid pedestrians and crashing, intoxicated bicyclists, etc.).
- In 1 of 39 car-bicycle crashes at a W&OD crossing the driver was given a citation for failure to yield. In 4 of the 5 rear-endings at W&OD crossings, drivers were written citations for hitting other cars.
- The text stated or implied who appeared to be primarily at fault in the crashes. Coding “fault” is imperfect (the “right” answer involves a court) but done best-effort as it provides useful, if only directional, insights. 50% of the time it was the driver, 40% of the time it was the cyclist, and the rest were unclear. This split is similar to the split found in other studies in other jurisdictions, suggesting that the coding is reasonably accurate.
- 8% of driver-fault crashes were car-car rear-endings at W&OD crossings. When the cyclist was at fault, almost 50% of these were single-vehicle crashes not involving anyone else. 30% included a reference to W&OD stop signs. 7% involved hitting a pedestrian, primarily on Broad or Washington. The other 13% were clear bicyclist-fault crashes (e.g., rear-endings, hitting parked cars, riding at night with no lights). No drivers were injured by a bicyclist striking their cars.
- Minor issues: Altercations (largely upset bicyclists) are rare but regular at 5% of total reports. Doorings are a minor issue, representing less than 2% of crashes. Cyclist-cyclist crashes are also rare at about 3% of crashes and most were friends riding together. The police logged only 6 complaints about bicyclists, primarily on the W&OD.
- Reported traffic stops are clustered in surges: 2017-2019 (18 reported traffic stops) and 2023 (96 stops). The majority of the recent stops were on the W&OD at Little Falls St (a low-crash location) but earlier stops are spread City-wide. These have typically occurred following complaints to City government about bicyclist behavior. There is no evidence (locally or nationally) for reduced crash rates or better bike trail stop sign compliance following episodic enforcement (see above on the design issue with the signs).