
Exploring How the Land of Detached Single-Family Home is Valued in Real Estate Assessments
By Robert A Speir and Peng Highnam.
Summary
At the beginning of each year, homeowners puzzle over their new real estate assessments, wondering how the values are derived and whether to submit an appeal. The land value component of the assessment for residential property has surged over the last decade, increasing real estate taxes for homeowners regardless of the state of their homes. In 2025, land accounted for over half the value of the total detached single-family home (SFH) assessment. In this first of a series of posts, we examine how the City values SFH lots, and how much they have increased in recent years.
The City describes their SFH value methodology as reflecting the principle of “diminishing returns,” that is, the larger the land parcel, the lower its value per square foot. Our analysis shows that the declining value rate actually results from amortizing a large, fixed fee applicable to all Falls Church SFH lots, $435,000 in 2025, rather than the more common volume discount accounting.
For SFH, land has the same value regardless of neighborhood. Therefore, a single relationship applies to all SFH lots throughout the City. However, we find that significant assessment discounts are given to a small number of lot owners for special circumstances.
From 2019 to 2025, over 80% of SFH land values increased 44-46%. SFH land values increased more uniformly and far greater than any other type of City real estate.
Real estate assessments and “fair market value”
Real estate taxes are the main source of revenue for the City. For single-family homeowners especially, these taxes have been increasing at a rate that far exceeds inflation and income growth, thus contributing to the housing affordability crisis. (See the Pulse post Single-Family Homeowners Bear the Cost of the City’s Growth, December 3, 2025.) By law, these taxes are a percentage (currently 1.185%) of the “fair market value” (FMV) of residents’ homes and land, as estimated by the Falls Church City Assessor’s Office in its annual “mass assessment.” That term distinguishes the process from the individual appraisals required by mortgage lenders and other financial market participants.
Virginia statute §58.1-3330(B) requires that the City determine and report to the taxpayer the assessed values for both the land and the improvements thereon. “Improvements” typically include the home and related decks, out buildings, patios, sheds, etc. With respect to land valuation, the Falls Church City Assessor’s website only says that “Land values are determined by sales of vacant parcels or sales of properties being purchased strictly for land value (teardowns). For most properties, land is assessed on a per square foot basis recognizing that larger or smaller lot values do proportionately increase or decrease based on the size of the lot.”
No further explanation is given. Yet the value assigned to the land has a particularly pernicious effect on owners of older, smaller homes where the land value now averages over two-thirds of the total assessment. Increases in the assessed value of land ensure that the base value of all assessments also increases.
Data sources and methodology
The City’s actual methodology is unknown to us. But by analyzing the City’s assessment data and drawing from our experience with assessment appeals and their public records, we were able to shed light on the assessment “black box.” Our primary reference is the City’s online assessment database and more detailed public database files that we purchased from the City. SFH in this post refers only to detached SFH. The land value of townhome, also single-family homes, will be discussed in a future post. The assessments of condominiums also have land value components, but land areas are not reported in the City’s real estate database for us to analyze.
The City’s assessment black box
Falls Church City’s assessment methodology has two totally separate parts: land and improvements. In the case of condos, it includes the apartment itself and special rights such as garage parking spaces. The City calculates these assessments independently and adds them together for a total that, when multiplied by the real estate tax rate, determines the owner’s annual taxes. Therefore, with no loss in accuracy, we can examine them separately.
We have found no evidence that the City has any substantive assessment methodology documentation. Nor does it provide references to publicly obtainable data sources for key model inputs. Absent that critical information, we have drawn conclusions about many critical relationships by “reverse engineering.” That is, we examined assessment valuations of various components of different properties, plotted the results, and developed equations or relationships that reveal key aspects of the process.
Determining the land value of single-family homes
When we plotted the 2025 land values per square foot against the lot size of 2,204 SFHs, a clear pattern emerged that agreed with the City’s comments online; that is, that the value of lots, on a dollars-per-square-foot-of-area basis, declines as lot size increases. That relationship for 2025 is shown in the graph below.
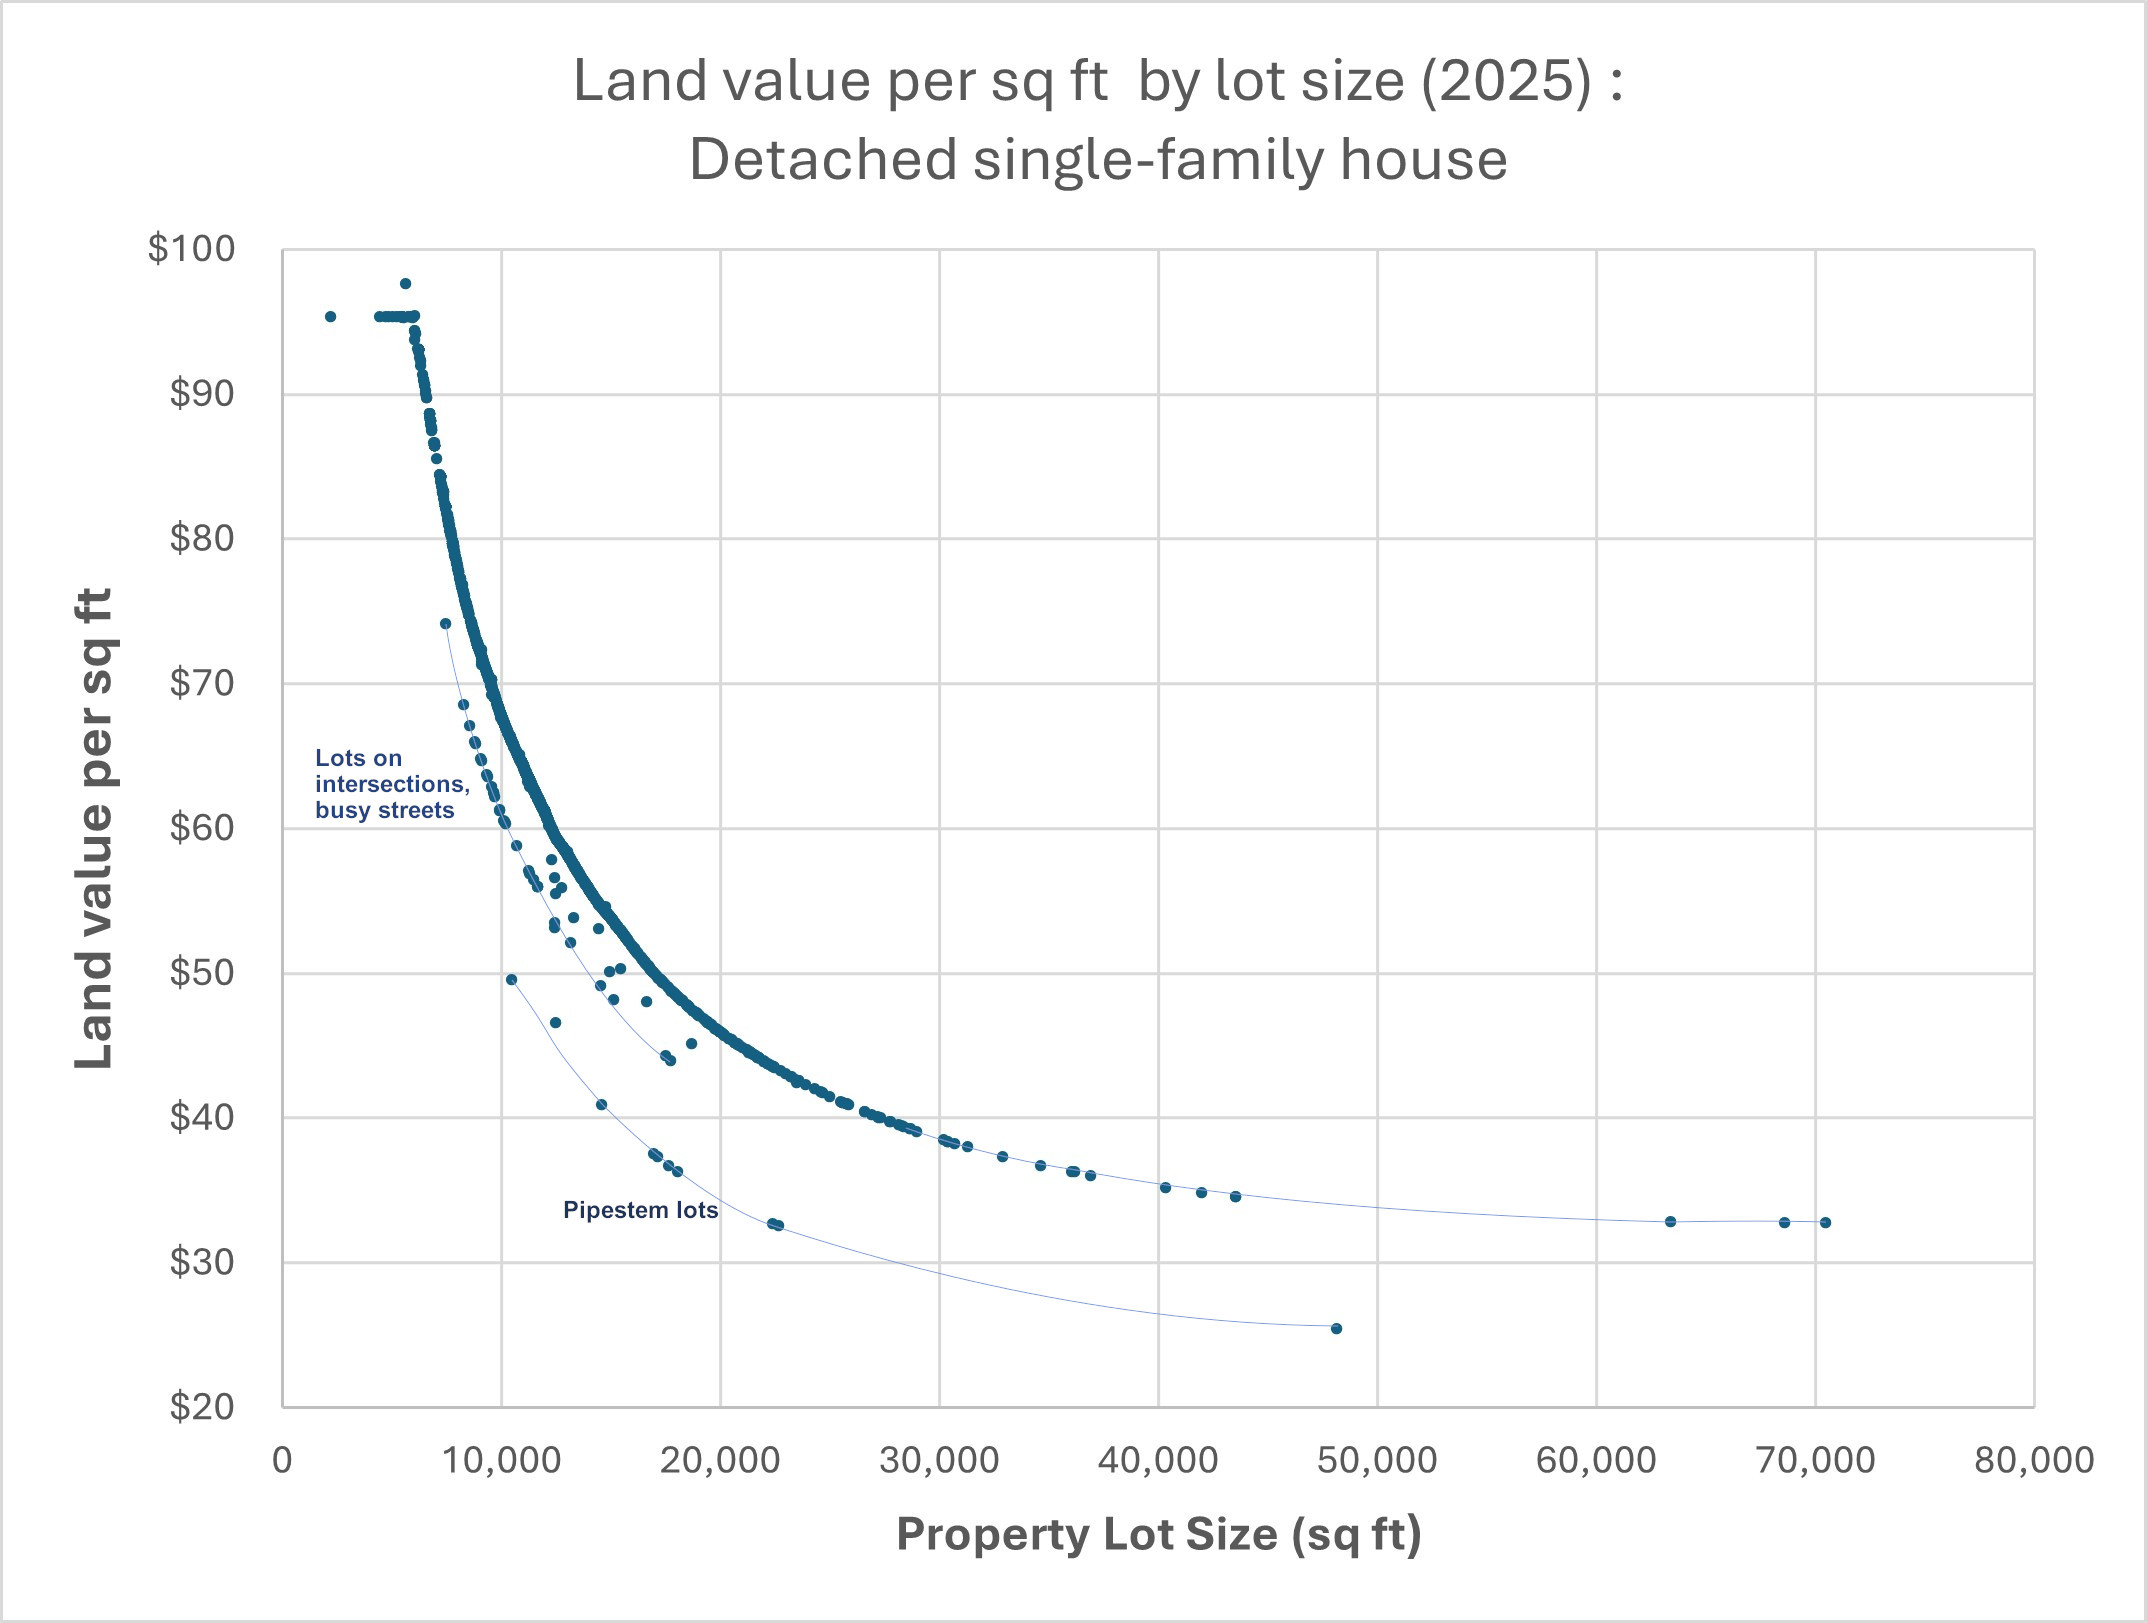
The data exhibit an exponential-type decay, the unit price of land being sharply higher for small lots, then flattening out significantly for lots larger than 20,000 sq ft (roughly ½ acre). Lots under 6,000 sq ft (0.14 acres) were priced at over $90/sq ft in 2025 while lots over 20,000 sq ft (0.46 acres) were priced at less than $46/sq ft. While we do not know the precise form of the City’s land pricing equation, the smoothness of the upper curve in the figure shows that there must be one. The graph also raises the question of pricing for the “outlier” points.
There are three distinct curves in this plot of land assessments. Over 96% of SFH lots in the City fall on the topmost curve. The lots that form a curve just below have discounts in the range of 10%. These lots are those with special circumstances. Some examples are corner lots, ones that have City easements or are located on streets with heavy traffic. The lots that form the lowest curve are pipestem properties, i.e. lots that have no street frontage except for driveway access. These lots have received discounts of about 25%.
It is important to note that not all pipestems or other lots potentially eligible for the discounts have received lower assessments. This raises a question about equal treatment of properties in the assessment process.
The three largest SFH are all historic properties over 60,000 sq ft (1.4 ac) – Lawton Manor, Tallwood, and Oak Haven. Their assessed values per square foot are under $33.
An easier way to describe Falls Church assessments for SFH lots
After plotting the above figure, we attempted to fit a formula to make it easy for readers to use—perhaps to compare their assessment to a neighbor’s lot or to determine the significance of an error in the City’s measurement of their own lot. Regrettably, we were not successful, so we tried a simpler approach.
Rather than plotting a dollars-per-square-foot-of-land area versus land area, we simply displayed the City’s assessment in absolute terms (i.e., dollars) versus the lot size in square feet (see figure below). After removing the discounted lot values, which we knew to be just percentage reductions in value from a non-discounted lot’s assessments, we were rewarded with a surprising discovery—all the assessment points essentially lie on a line. Its equation, shown on the figure below, indicates that assessment value can be depicted as a large constant figure of $435,119 plus a variable amount of $24.49 per square foot of land. We find that this equation predicts lots’ assessments to greater than 99% accuracy over the range of most of the lots in Falls Church.
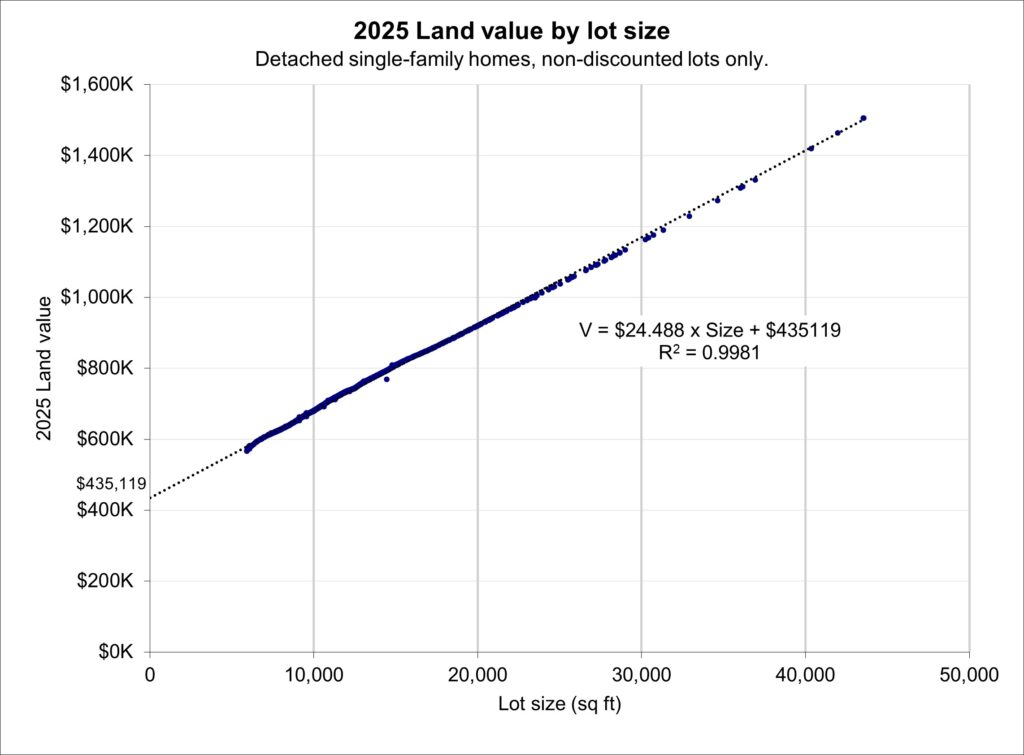
The City Assessor’s Office explains the decline in the dollars-per-square-foot assessment rate when a lot’s size increases as the result of the “principle of diminishing returns.” Economic jargon aside, our simpler plot of the 2025 assessment data alone shows that the decline in unit assessment values is the result of amortizing the large, fixed “fee” of $435,119 over an increasing number of square feet as lot size increases. That is, the larger the lot, the more area over which to spread the fixed fee, thus bringing down the overall cost per square foot. That produces what the City calls their “diminishing returns.”
As an example of this more direct formulation of land value, we can quickly calculate the difference in the assessed values of two single-family home lots, neither of which has an assessment discount, as $24.49 times the difference in the sizes of the two lots. For example, the Falls Church City lots at 125 S Spring Street and 211 Midvale Street are 11,250 and 13,965 sq ft, respectively. According to our calculations, their assessed values should be $66,490 apart. Their actual assessed values are $714,700 and $780,900, respectively. That difference is $66,200.
The real significance of the fixed fee is that it constitutes a rather large source of assessed value. For example:
- the ubiquitous ¼ acre SFH lot would have a 2025 assessment of about $701,815, of which the $435,119 fee is about 62%, and
- from the approximately 2,200 SFH in the City, this mysterious value brought in over $11 million in tax revenues in 2025, accounting for a third of the SFH real estate taxes.
The uniform rise in SFH land values from 2019 to 2025
The land value acts as the lower limit on the assessed value of properties in the City. A rise in land value affects all properties regardless of the state of the house. This is particularly true for older homes. For single-family homes older than 20 years, the land value was about two-thirds of the total assessed value on average in 2025, and as much as 85% of the total assessed values in some cases.
The graph below compares the unit land values for 2025 with 2019 for SFH. In six years, the unit land values increased 45% on average with a corresponding increase in the overall land value of properties.

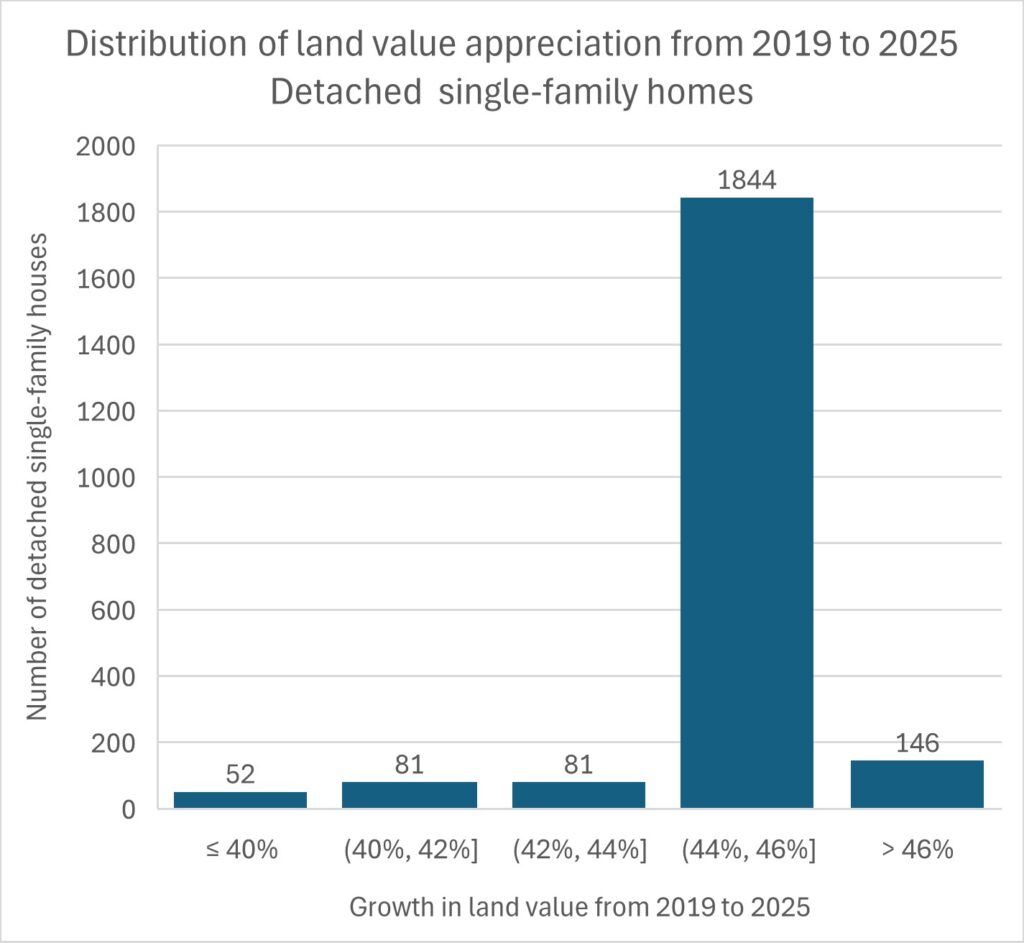
The appreciation in assessed land values from 2019 to 2025 has been remarkably uniform across all SFH. The histogram below shows the percentage growth for 2,204 SFH, 94% of the City’s total SFH. The remainder were omitted because they were partially in Fairfax County or Arlington County or did not exist in 2019. The land of 1,844 properties (84%) appreciated 44-46%. It shows the uniformity of the increase and that neighborhood was not a factor. A uniform increase in land value has a greater impact on the taxes of older, smaller properties because land is two-thirds of their assessed value on average.
We observed further confirmation of the similarity of 2019 and 2025 methodology and assessments when we converted the 2019 assessments to a linear format as we did above with 2025. We found that the 2019 fixed fee value was about $293,000 and the per square foot add-on value was $17.27. When we computed assessment values for lots between ¼ and a full acre, we saw 2019 to 2025 increases of 44% to 46%, just as in the histogram above. That generally suggests that there was little, if any, significant change in land value calculation during those years other than multiplying by some chosen constant appreciation value.
Land values for SFH surged ahead of others
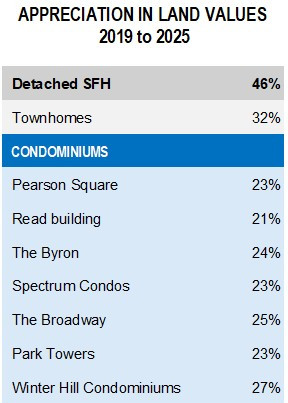
As mentioned earlier, it was not possible to carry out a similar analysis for condominiums and apartment buildings because the area of land assigned to each unit was not provided. However, we can compare the increase in the overall assessed land values by development. The results are shown in the table. (Note that the Read and Pearson Square multifamily buildings are condominiums, although their units are owned by single corporations and all rented out.)
Land values clearly did not increase at the same rates across the City from 2019 to 2025. The increase was substantially different for SFH, townhomes, and condominiums. The City Assessor said that neighborhood was not a factor in determining land values, so location was not the cause for the differences. SFH land increased by 46% on average. Land values, as shown in the chart below, for townhomes averaged 32% but ranged from 18-46% for reasons not apparent to us. Condominium land values increased at roughly half the rate of land for detached single-family homes.
Concluding remarks
The City’s, and many residents’, focus on dollars-per-square-foot valuation sometimes obscures the relative importance of the structure of the City’s land pricing model with its large, fixed fee. Additionally, the reasons for the substantial escalation in land values in the last 5 years warrants justification. These are related issues. However, there seems to be no documentation describing the way the City used data on undeveloped lots’ sales prices, or on sales of houses and their land to teardown builders to construct its mass assessment model. If the fixed fee discussed here is inaccurate, inconsistent or unsubstantiated, the entire “diminishing returns” land assessment pricing curve would be inaccurate.
In future posts, we hope to be able to clarify the methods by which the City values land associated with townhome complexes. At this point, we can say that it is substantially different from the rather transparent method applied to single-family lots. But, of course, no documentation is available for townhomes either.
References
- Falls Church City Assessments Property Database. Search for property records, current and historical real estate assessments.
- Falls Church City Assessment Process. Official webpage explaining the City’s assessment process.