Falls Church Demographics: The Impacts of Growth (Update)
Update
The update to the Demographics chapter (Chapter 2. People, Housing and Jobs) of the City’s Comprehensive Plan was approved by the City Council unanimously at its June 10, 2024, meeting. The new chapter is available at Chapter2- Demographics_v7.
In response to concerns that the City has failed to predict the impacts of growth on its infrastructure (see the Pulse posts on Sewer), this chapter now includes a section entitled Public Infrastructure, Facilities, and Services. Within this section, Strategies are specified that direct staff to anticipate the impacts of population growth from new development on the existing infrastructure and public services.
To ensure that “growth pays for growth”, a Strategy specifies that fees and permits should be reviewed regularly to ensure that development pays its fair share of public costs.
Reference
- June 10, 2024, City Council meeting. This video will not play properly on a small screen because it includes the agenda.
- June 10, 2024, City Council meeting agenda. This meeting agenda contains links to documents relevant to the Demographics chapter update.
March 12, 2024.
Summary
Detailed demographic data are used by the City to inform strategic planning. This periodic review updates the Demographics Chapter of the Comprehensive Plan. The City uses US Census Bureau data, internal records and a commissioned study. Data show:
- a revised projected population increase of 21% from 2020 to 2030, driven by mixed-use developments.
- an increase in high-income households from 2016 to 2021.
- 27% of homeowners with no mortgages are burdened by housing costs, the bulk of which are real estate taxes.
Data are not currently used to predict the impacts on critical infrastructure, leading to an unanticipated sanitary sewer bill estimated to be more than $20 million.
Background
At the February 20, 2024, City Council work session, City staff presented the first draft update of the Demographics chapter (last updated in 2019) to the City’s Comprehensive Plan. This chapter includes housing and employment within the City. Demographic data and projections are a critical source of information for City planning and prioritization. This draft was also shared with the Planning Commission at their February 7, 2024, meeting.
The historical demographic data are from the American Community Survey (ACS) conducted by the U.S. Census Bureau. The historical analyses compare the period 2012-2016 to 2017-2021. It is not clear how much of the pandemic effects are captured in the 2021 ACS survey.
Population projections revised downward
The population projections presented by the Stephen Fuller Institute (SFI) consultants at a joint December 4th, 2023, City Council and School Board meeting have been revised downward due to discovered methodological errors and a reduction in the size of future condo households. The December 2030 population projection of 19,797 was corrected to 17,755 or a 21% increase from 2020 to 2030. There were also corresponding but much smaller downward revisions of the school enrollment numbers for 2030 and beyond.
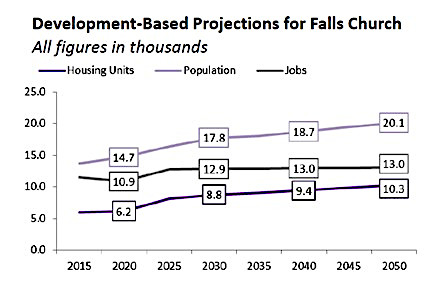
The growth in the population of Falls Church is driven by the increase in housing stock in the City. (See the Falls Church Pulse analysis Falls Church City Mixed Use Development Projects.) Over 1,000 mixed-use project units were added in the last decade, and nearly 1,600 additional units are now under construction or have been approved by City Council, with more already being proposed. From 2020 to 2030 the Fuller Institute projects a 42% growth in total housing units. These projections include the anticipated impact of the new T-Zone code but do not account for additional housing if the accessible dwelling code is changed.
A comparison of our population growth rate with the surrounding jurisdictions shows that only Alexandria and Fairfax City are projected to grow faster, also due to the planned developments currently underway in those localities.
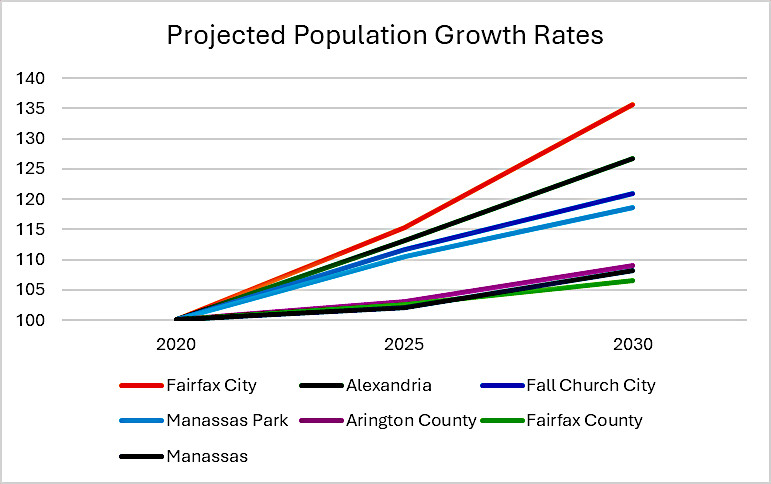
The capacity of a locality to absorb the population growth can be measured by its population density. Increased density brings increased congestion, infrastructure and environmental issues and changes to the character of the place. Based on the 2020 Census, Alexandria was already the densest locality in this area at 10,391 people per square mile, while Fairfax City had a low density of only 3,825 people per square mile. Falls Church’s population density was 7,174.
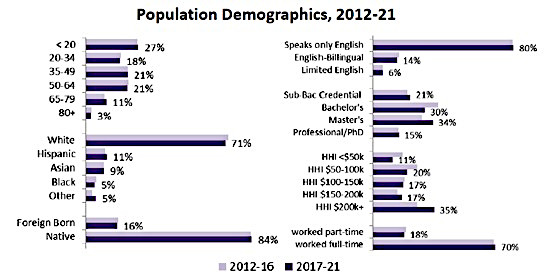
Population profile mostly unchanged, somewhat richer
The population age and ethnic mix by 2021 was little changed, according to the Census data. However, there was an increase in the number of people in the two highest income brackets ($150K to over $200K income per household, rising to 52% of the total population), and a corresponding decrease in the number of people in the lower income brackets. According to the latest (2022) ACS estimates, the median household income for Falls Church City is $164,536; men made $147,300 while women made $1-3,273.
But are we the richest?
The Staff Report (starting on line 163) states that between 2012-16 and 2017-21, the City’s median household income grew by 35 percent, more than double that of Fairfax (17%). It would be more appropriate to compare towns or urban areas to each other than to entire counties. In fact, income growth varied greatly across Fairfax County. Below is a comparison of the City’s income growth with nearby urban areas. Farifax County urban areas are shown in green. Vienna and the Pimmit Hills areas also experienced high growth at 40% and 39%.
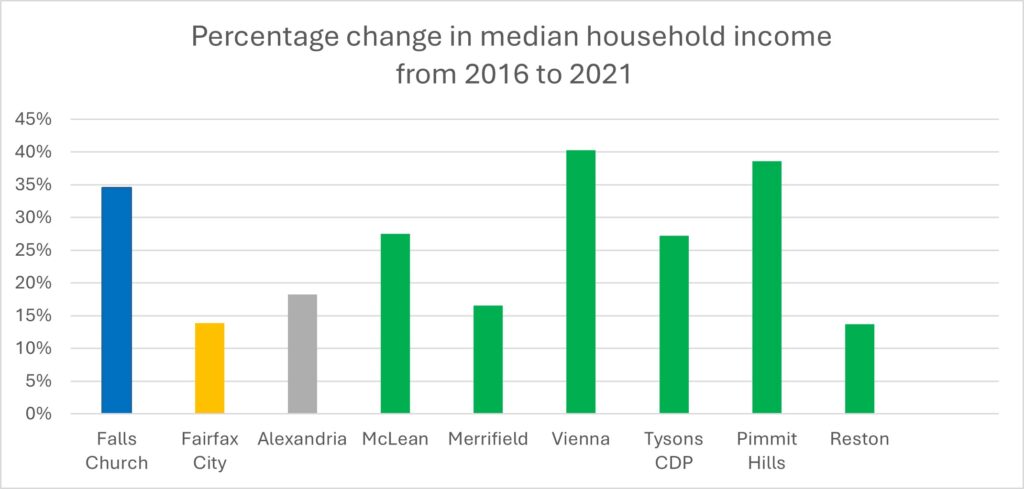
Source: ACS 2012-2021, Table B 19013
Within this group, Falls Church was not the richest locality. According to the 2022 ACS estimates, McLean had the highest median income at $250,001 and Vienna was second at $215,556. Falls Church had the third highest median income at $164,536.
Households – Families, Singles, Seniors
The City has more than 6,500 housing units, about 1,000 of which were apartments built in the last 10 years (2013-2023). As of 2022, 3,600 (55%) out of the 6,500 units are multi-family units. From 2016 to 2021, there is a significant increase in families with children and a decrease in single, working-age households. Despite the increase in families with children, the school enrollment projections are still modest according to the SFI report. (See Falls Church Pulse analysis 15% Enrollment Growth By 2030 Projected For City Schools.)
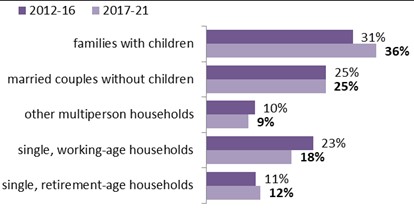
14% of Falls Church residents are over the age of 65. According to the ACS data, this is similar to the surrounding localities. Many of these seniors live alone, making up 12% of the households in the City.
Who has difficulty affording to live in Falls Church?
According to the SFI Regional Trends report, 57% of the housing units are owner-occupied, 43% are rentals. Of the homeowners, ACS data estimates that 30% have no mortgage. The table below shows the percentage of households in each group that spend 30% or more of their pre-tax income on housing costs. These costs include rent, mortgage payments, home insurance, real estate taxes, utilities, condominium and homeowners’ association fees.
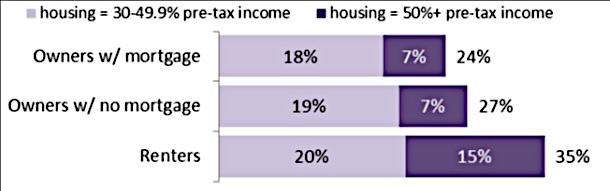
The Census Bureau considers 30% of pre-tax income to be the limit beyond which that household is “burdened” by housing. Among renters, the bar graph shows that 35% of those households spend 30% or more of their income on housing costs, with 15% of those households spending 50% or more of their income. Likewise, 24% of homeowners with mortgages and 27% of homeowners without mortgages are burdened by housing costs.
This graph was the subject of discussion at both the City Council and the Planning Commission meetings. City staff pointed to it as an indicator that many do not have the high incomes needed to support housing costs in the City. Planning Commissioner Derek Hyra, who has long studied this issue, cautioned against reading too much into these data. He said that some very high-income homeowners choose to have large mortgages that would be captured in this graph. Presumably, the same could be true of renters.
Councilmember Erin Flynn was concerned about the 27% of homeowners without mortgages for whom housing costs still consumed 30% and more of their income. This suggests to her that the real estate taxes were a burden for these homeowners. She said the data were consistent with the Falls Church Community survey conducted in Spring, 2023. In that survey, the top concern for respondents was the amount of local taxes. She would like to see the Comprehensive Plan include strategies for tax relief so that current homeowners do not get priced out of the City.
Councilmember David Snyder questioned whether the Census Bureau’s standard of 30% was the appropriate limit for housing to be considered a burden here. In a metropolitan area, housing cost includes services that are not available in a rural area, so that 30% might be appropriate for a rural area but not for a city, he said.
Mayor Letty Hardi noted that these data are “supply-based”, about who is here now and what are their needs. What is missing for her is who wants to live here but can’t, and that might drive different strategies. She wondered if comparisons with our neighbors might give us a sense of the accessibility of our City and what the housing demand could be.
The out-migration puzzle
The proposed Demographics chapter includes a chart on the change in incomes of the people moving into and out of the City, shown below. There was a 42% increase in the incomes of people leaving the City in 2019-2020, possibly an impact of the pandemic. Staff interpreted the data to say that “The outmigration of wealthier residents may suggest an increase in the income required to live in the City.”
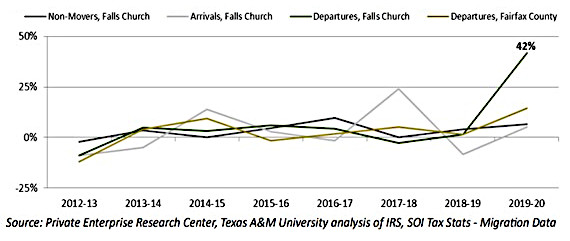
Ms. Flynn cautioned against extrapolating from the data because there could be multiple reasons for the income change. Mayor Hardi added that during the pandemic, there was a regional trend where those with resources moved out of dense urban areas “so it’s often your high-income people who have the ability to pick up and move.”
Rental vacancy rates
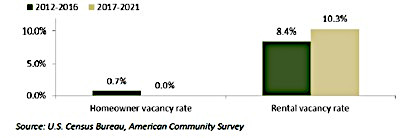
The rental vacancy rate increased from 8.4% to 10.3% from 2016 to 2021. Vacancy rates are higher for smaller units – 12% for 1-bedroom and studios; 7% for 2-bedroom and 3% for 3-bedroom units. Fairfax County had a vacancy rate of 7% during this period. For the DC metro area, it was 9%. (See Staff Report, February 5, 2024.) This may be an indication of a mismatch between rental stock and rental needs.
Employment post-COVID
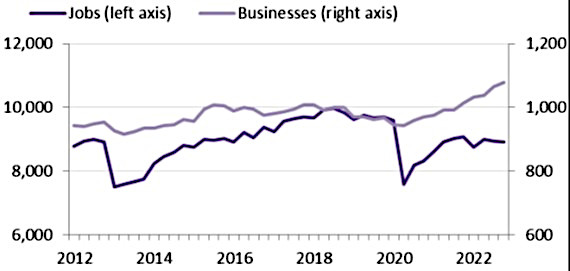
According to 2020 payroll data, 56% percent of businesses in the City are small with less than 5 employees. 86% employ fewer than 20 people. The graph above shows that there has been an increase in businesses in the City of about 10% from pre-pandemic levels. Despite that, the number of jobs in the City has yet to recover from the pandemic shock.
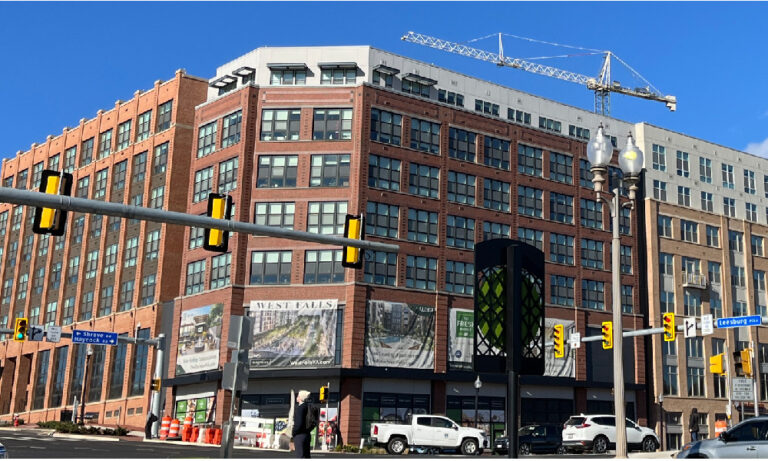
Councilmember Marybeth Connelly commented that the low amount of office space might be the reason behind the low rate of local employment. She was recently at the opening of a new medical office building at the West Falls Development, something that hasn’t happened in a long time. (This is a double-edged sword. Falls Church has a lower commercial vacancy rate than surrounding areas because it has less commercial office space.)
Working from home
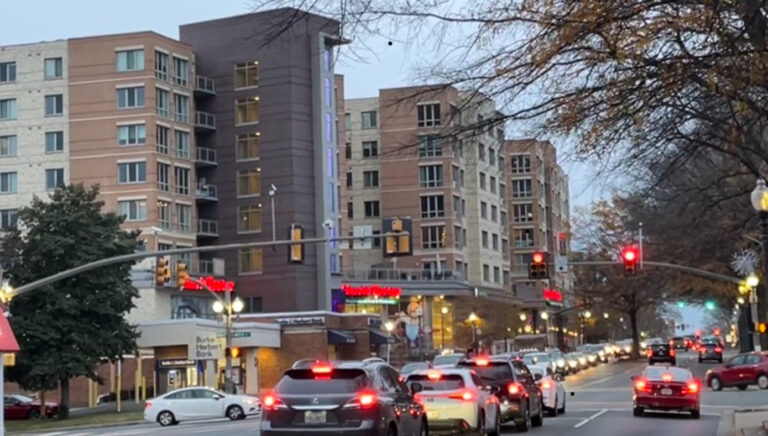
The vast majority of City residents (93%) are employed outside the City, though they may be working from home some of the time. 33% work in Fairfax County, 24% in Washington D.C. and 12% in Arlington.
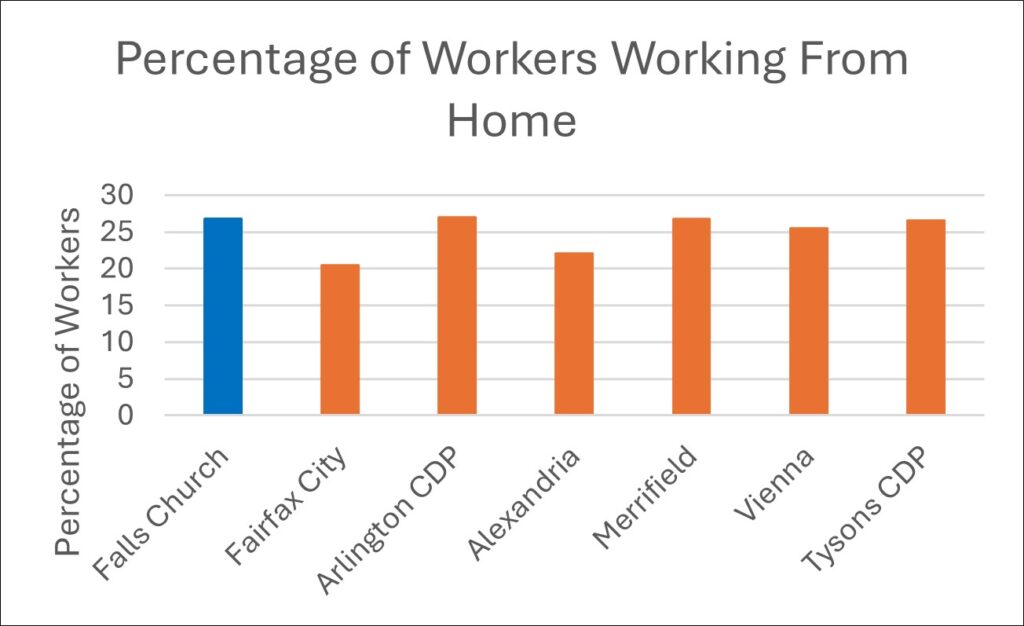
Understanding work patterns can provide information on commuting traffic and infrastructure needs. If many workers work from home, then the City does not empty out during the weekday. That data can be used to attract restaurants and other businesses to the City.
ACS data are limited in that respondents are asked to list only one location, the one where they spend most of their work week. That number underestimates the number of workers who have hybrid work arrangements. The following table, based on ACS data, is not part of the demographics study but is included here to give further insight. 26.8% of Falls Church residents report working from home. Falls Church is fairly typical of the surrounding area.
A need to use data to predict infrastructure investments
Councilmember David Snyder said that the report gives short shrift to infrastructure and feels like an agenda to push housing, rather than saying this is the data and there is a lot of infrastructure to catch up. He would like to see the impact on public safety, police, and firefighters. He pointed to the problems today with our sewage infrastructure. The City is contending with a $20+ million bill to expand the sanitary sewer infrastructure. (See The Little City’s Big Sewage Challenge – Part 1.)
Mr.Snyder wanted to know when we will use these data to tell us what we will need regarding police, fire, electric, stormwater, sewer, etc. to plan for investments and to understand the full cost of these developments.
Planning Commissioner Andrea Caumont echoed Mr. Snyder’s concerns at the Planning Commission meeting. She said the sanitary sewer issue was a surprise. She recommended that critical facilities should be called out more specifically in the Comprehensive Plan.
The process of updating the Demographics chapter
Staff will continue to work on revisions to this chapter based on feedback from Council, boards, and commissions. The schedule is for the final draft to return to Council for approval in June, 2024.
Addendum on the Comprehensive Plan
The City’s Comprehensive Plan is probably the most underappreciated of the legal documents in City Hall. It documents the policies of the City. Within it are stated goals and strategies that are translated into action plans. They are not just lofty goals but are used to justify approval of projects and proposals that determine the City’s financial health and affect the character of this community.
For example, the Land Use and Economic Development chapter of the Comprehensive Plan states the following goal:
“Goal 11. Provide for mixed-use development areas composed of retail, office, and residential uses.”
This has been used to justify all mixed-use development in the City. Another goal:
“Goal 4: Ensure that the Zoning Ordinance is user-friendly and is achieving the type of development that the City desires.
Strategy A. Base residential and commercial density on dwelling units per acre and floor area ratios rather than on minimum lot sizes, building setbacks, lot coverages and number of stories.”
This goal and its first strategy provided the rationale behind the new T-Zone ordinance.
References
- Why We Ask Each Question, an easy-to-use interface to get the latest snapshots from the US Census Bureau’s American Community Survey
- Chapter 2 – Demographics_v1_1.23, draft of the update to the Demographics chapter of the Comprehensive Plan, February 20, 2024.
- Demographic Chapter Update Presentation, presentation slides for the City Council work session, February 20, 2024.
- Comprehensive Plan Demographics Chapter Adopted 2019
- Demographics Chapter Update Staff Report Updated 2.5.24, presented at the Planning Commission meeting, February 5, 2024.
- Regional Trends Report_11.28, Dr. Keith Waters, Dr. Terry Clower, and Elizabeth Hughes, Stephen Fuller Institute, George Mason University, November 2023.
- Demographic Projections Final, Dr. Keith Waters, Dr. Terry Clower, and Elizabeth Hughes, Stephen Fuller Institute, George Mason University, February 2024.
- The Washington Metropolitan Council of Governments (COG) report, Round 10.0 Growth Trends to 2050, October 2023.
- City of Falls Church Community Survey Presentation, Probolsky Research, May 2023.
- City of Falls Church Community Survey Report, Probolsky Research, May 2023.
- Council Work Session, February 20, 2024. This video does not display properly on a small screen because it includes the agenda.
- Council Work Session, February 20, 2024. YouTube video.