Falls Church City Population Growth Of 35% From 2020 To 2030
Update: (March 12, 2024) The Stephen Fulton Institute revised their estimates for population growth downwards to 21% from 2020 to 2030. The new estimates are discussed in the Pulse post Falls Church Demographics: The Impacts of Growth.
Summary
December 8, 2023
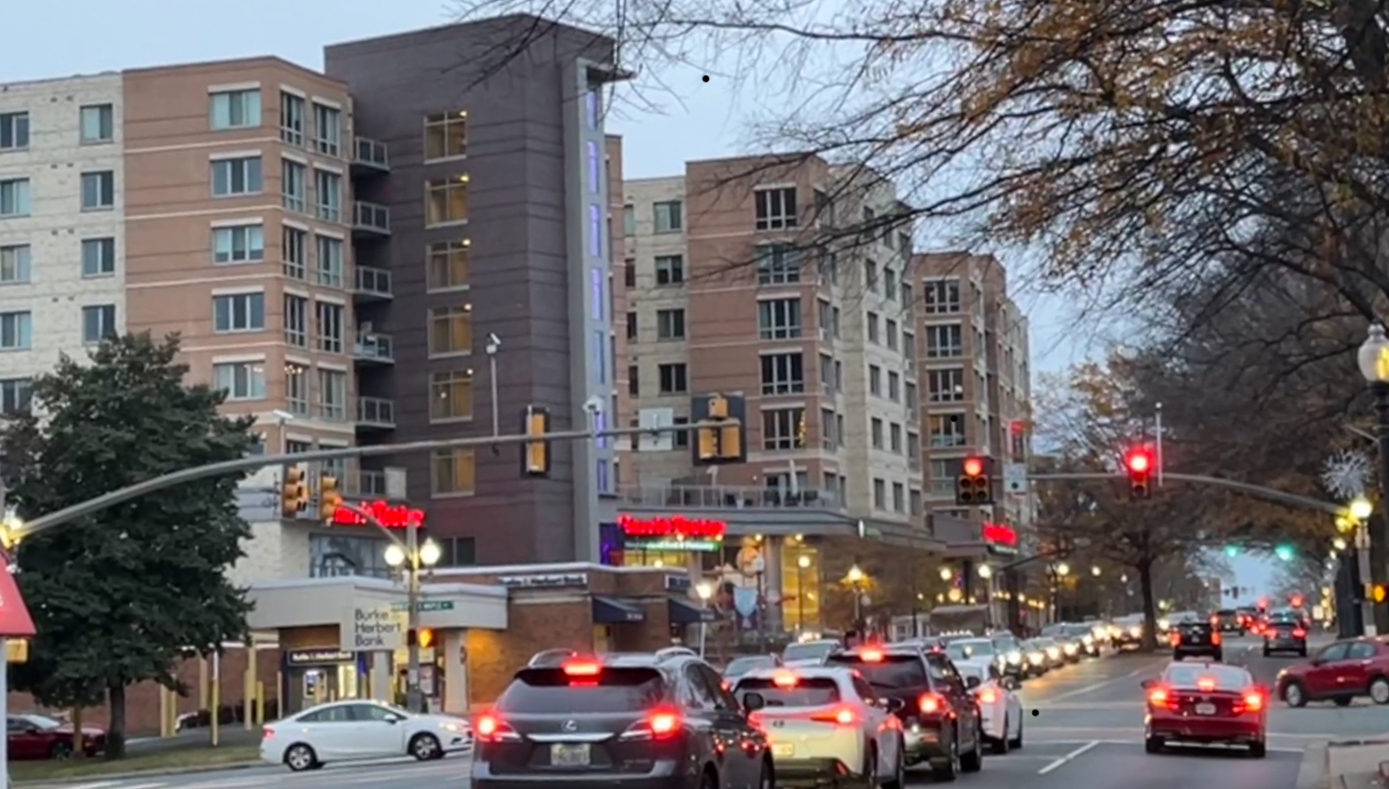
The City of Falls Church is undergoing a boom in development projects that will significantly increase its housing stock. According to a commissioned study by researchers at the Stephen Fuller Institute designed to capture the impact of these projects, the City’s population will increase by 35% from 2020 to 2030. Such growth makes the City’s population density one of the highest in Northern Virginia. Arlington County is expected to grow by 9% and Fairfax County by 7% over the same period.
Meantime, trends in the greater metropolitan Washington area show an economic slowdown in employment and gross domestic product (GDP) growth in recent years that may extend into the medium-term future. These trends may have an impact on the City’s population growth and rental occupancy that is not factored into this study.
A study of the impact of housing growth on Falls Church’s population growth
Falls Church City schools contracted with Dr. Terry Clower and Dr. Keith Waters of the Stephen Fuller Institute (SFI) at George Mason University to project the growth in public school enrollment. These data also included growth projections and demographics of the City’s population. Their enrollment growth forecasts and the impacts on the City’s schools are discussed in our companion post, School Enrollment Growth Projections For Falls Church City.
During the November 14, 2023, School Board meeting, Dr. Clower presented the results of this study. Dr. Clower is the director of the Center for Regional Analysis at the Stephen Fuller Institute and professor of public policy in the Schar School of Policy and Government at George Mason University. The researchers also made a presentation at the December 4, 2023, joint School Board and City Council work session that included regional growth trends.
School Superintendent Dr. Peter Noonan explained that projections used by the school system for planning and budgeting are typically provided by the Weldon Cooper Center (WCC), University of Virginia. However, those projections do not consider the significant increase in housing currently under construction in the City. SFI was specifically asked to incorporate these factors into their projections.
The SFI reports include a catalogue of the existing townhouses and multi-family developments in the City, student numbers for each, and single-family dwellings data as of 2023. Data from the last 2020 US Census are also used. Although the SFI projections go out to 2050, we only consider the projections to 2030 for this post. This near-term range accounts for the impact of all the developments currently under construction and, therefore, should be more accurate.
Housing growth
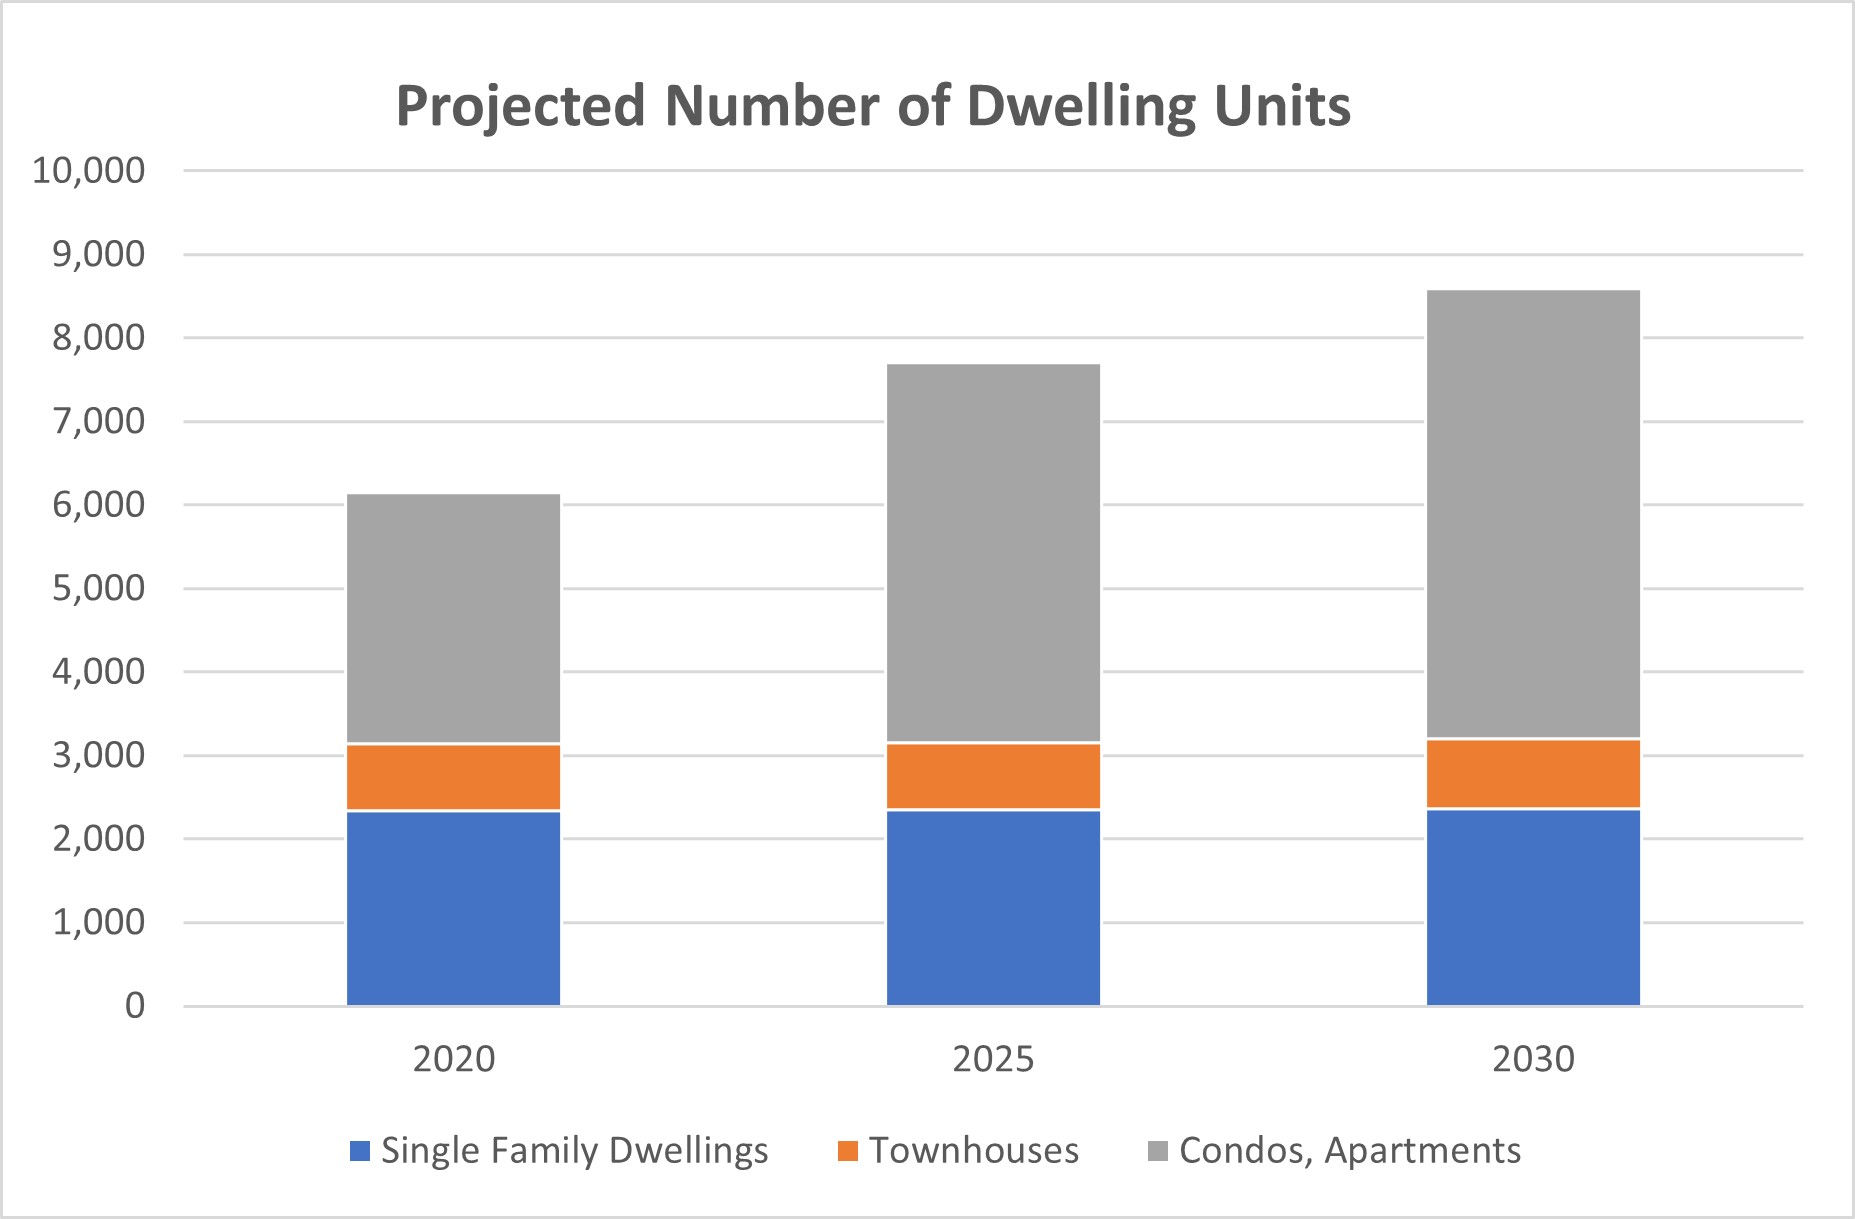
The population growth in the City is driven by current and future construction of housing units. The SFI report provides a detailed account of the housing that currently exists in the City, categorized by type and age. In 2020, there were 2,330 single-family homes, 816 townhouses and 3,007 condos or apartments.
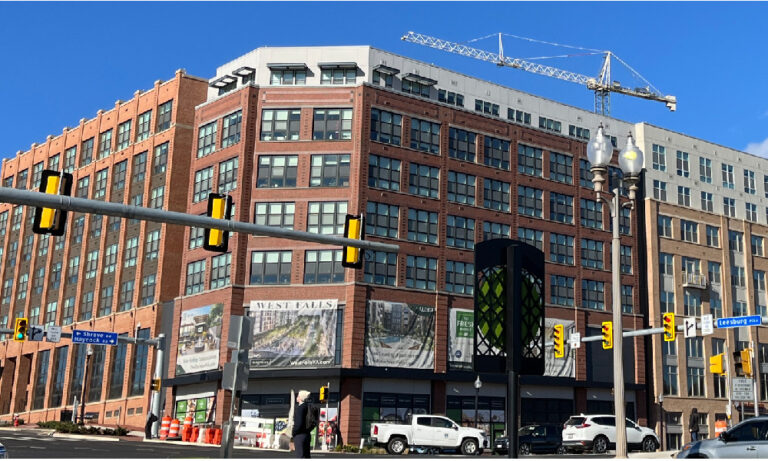
By 2023, the number of single-family homes increased slightly. The number of townhouses did not change. Founders Row was completed with 394 new units. However, with the completion of Founders Row, and future completion of the Founders Row II, Broad and Washington, and West Falls Phase I developments, the City is estimated to have 4,540 condos and apartments by 2025. This is a 51% increase in condos and apartments over 2020 or 1,533 units. Except for 125 condos in West Falls, the remaining units are all rentals. Our post, Falls Church City Mixed Use Development Projects, analyzes these developments.
Assumptions
The SFI model assumes that the City will add six townhouses annually in the future, and two single-family homes annually to 2028, then one per year beyond 2028.
Founders Row II, Broad and Washington, and West Falls Phase I are expected to be completed by 2025. From 2026-2030, we expect that West Falls Phase II will be completed, adding 149 condos and 215 senior apartments to the City’s housing stock. In addition, the SFI model estimates another 414 units of apartments or condos will be built.
Housing projections
The chart below shows the dwelling mix for 2020 and the 2025 and 2030 projections based on these assumptions.
Population Growth
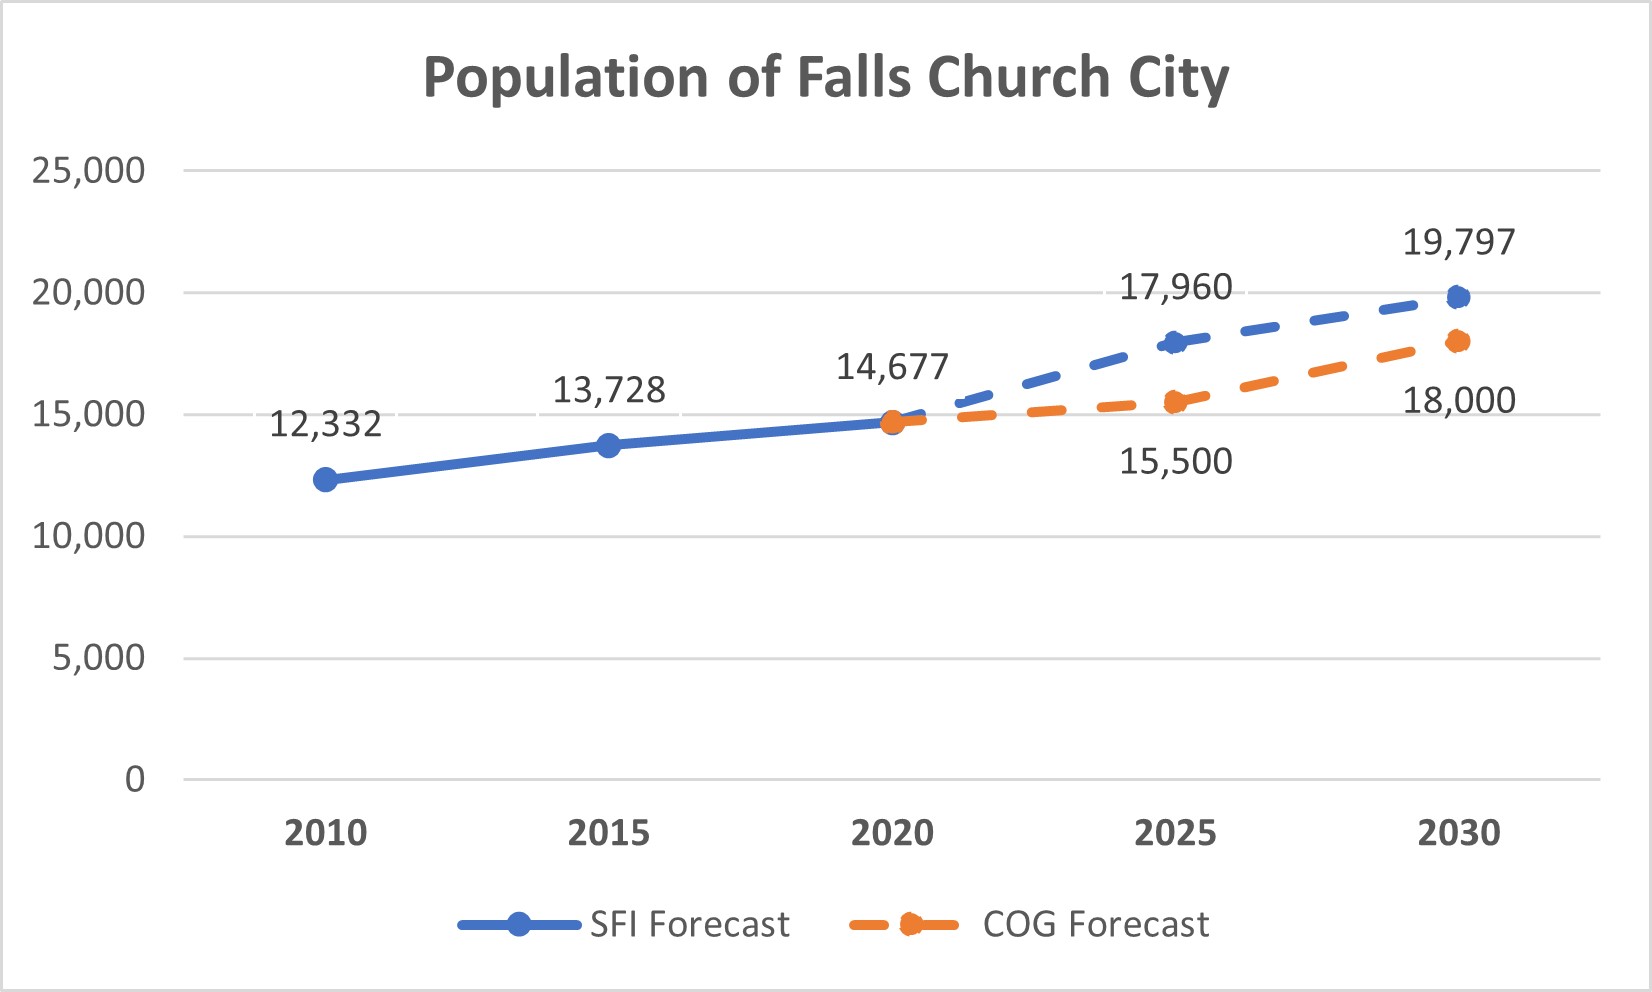
Much of the population growth comes from the mixed-use developments in the City. Factoring in an 18-month period for occupancy of such developments to “stabilize” once completed, historical vacancy rates for rentals, and typical household sizes for the types of units being constructed, the SFI researchers projected the population of Falls Church City to grow by 3,283 people between 2020-2025, and then 1,837 between 2025-2030. Between 2015 and 2020, the population grew by only 949 people.
The chart below shows the SFI forecast in comparison to the City’s previous population forecast submitted to the Metropolitan Washington Council of Governments (COG).
We can compare the SFI growth rate estimates to those of the surrounding areas. The Washington Metropolitan Council of Governments report (COG) contains population growth forecasts for these areas. The following graph shows the population growth rates of each jurisdiction from 2020, when the last US Census was conducted.
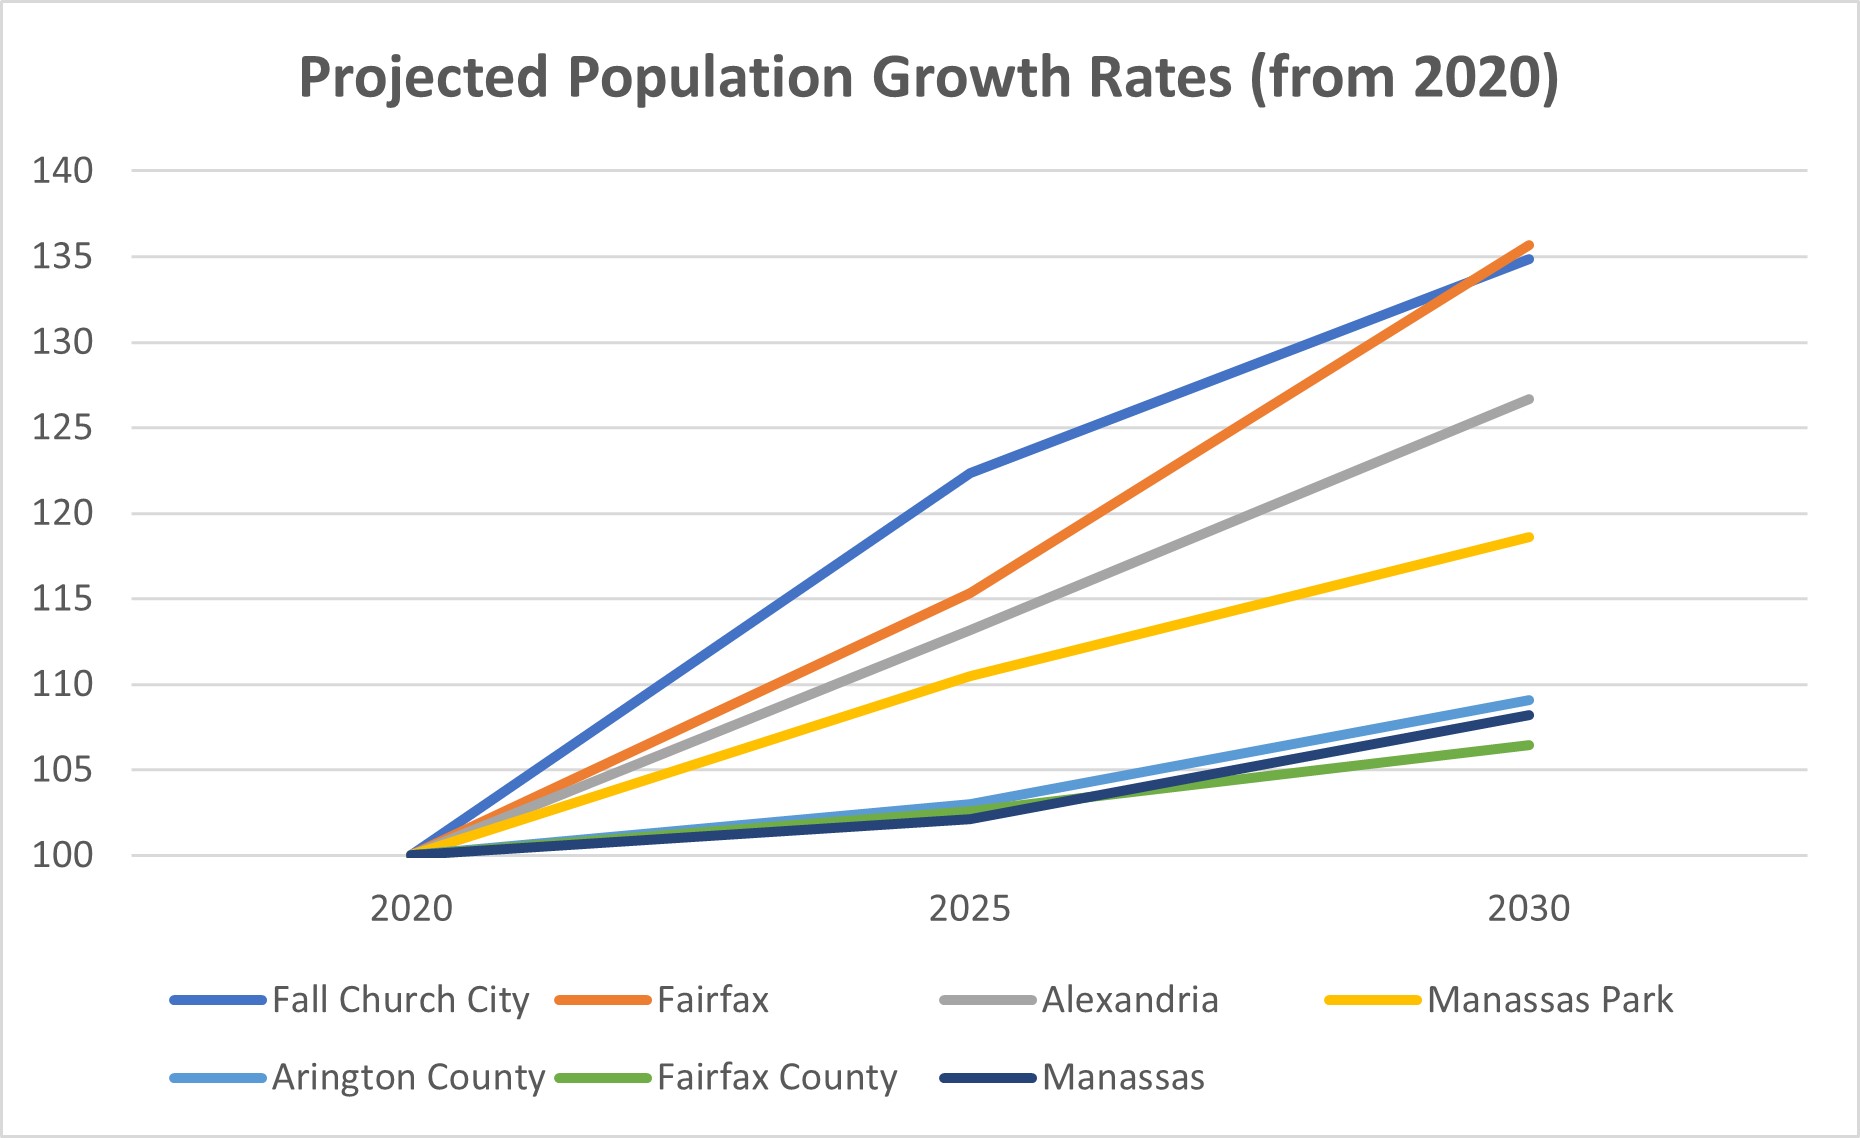
The graph shows the City growing by 22% from 2020 to 2025, driven by the mixed-used projects currently under construction. The West Falls project and projected developments will continue to drive the population growth up to 35% by 2030. This growth is matched only by the City of Fairfax. Arlington County is projected to grow by 9% and Fairfax County by 7%.
Are we doing enough to address the housing crisis?
In recent years, City staff and certain City Council members have referred to a regional housing shortage as the justification for the mixed-use developments that have been approved and to zone for greater housing density as in the new Transition Zone code. (See the Falls Church Pulse posts on the Transition Zone issue.) They have stressed to the community that we must do our part to provide needed housing.
One way to see if we “have done our part” is to compare the density of housing of Falls Church City with the surrounding areas. Since population and housing are closely correlated, we can compare population densities per square mile to gauge our contribution to housing. The data shows we are already among the top three densest areas in this region today. We are certainly not falling behind in contributing to easing the “housing crisis”.
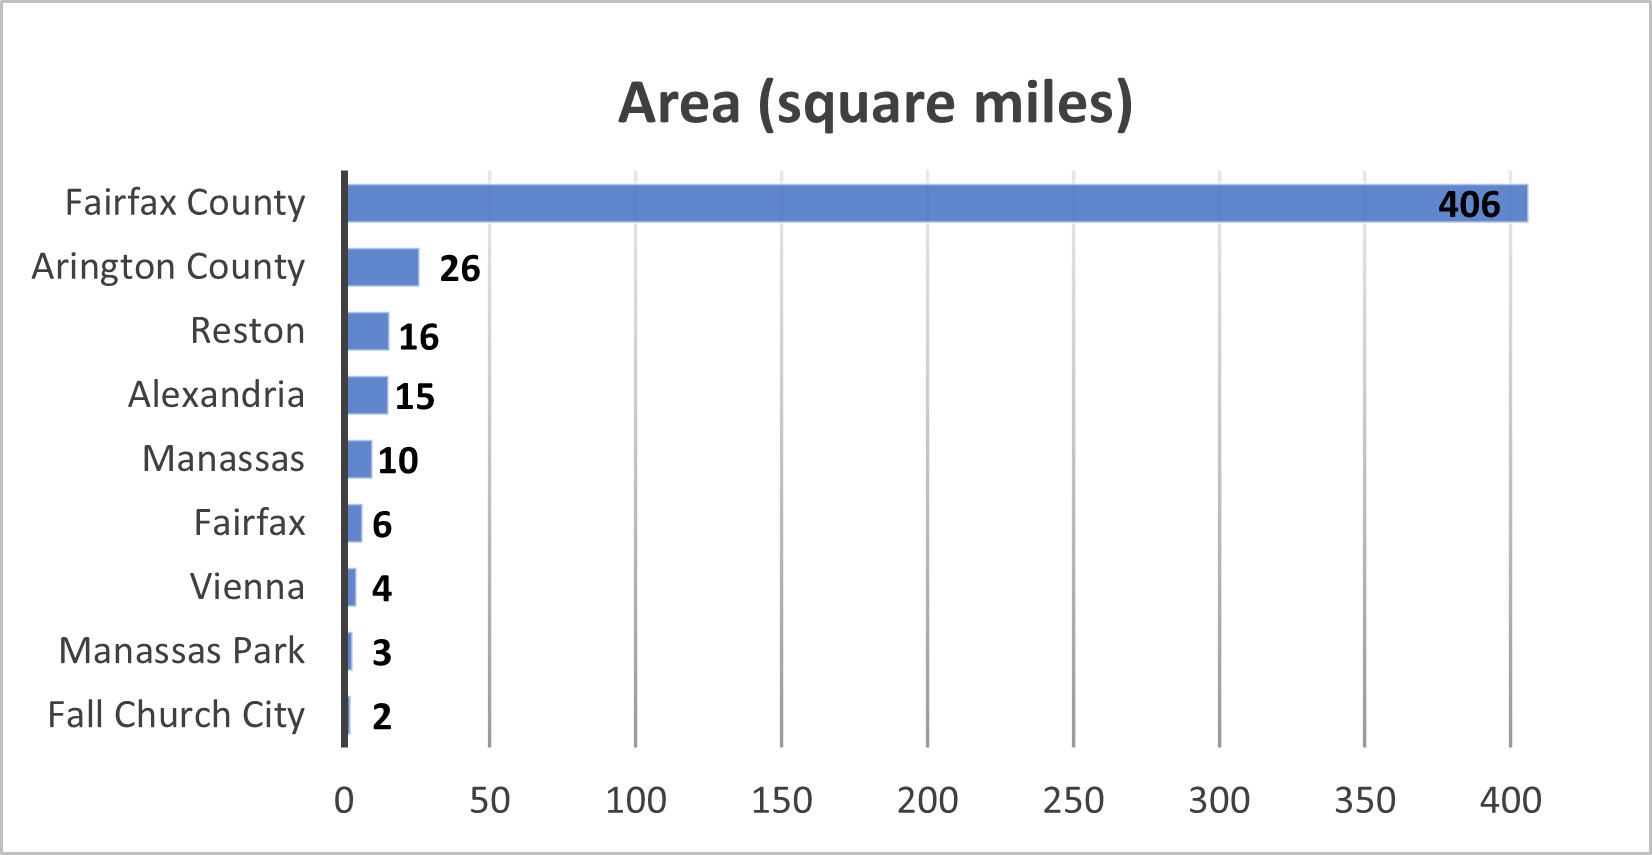
The table below shows the areas of each of the surrounding jurisdictions. We include Reston and Vienna as they are similar in characteristics to Falls Church, both with good transit amenities and separate population Census data available for 2020. We were not able to find population projections for them.
The graph below shows the population density (people per square mile) of each area. The SFI population estimates were used for Falls Church City, the COG data for the surrounding areas, and the Census data for Reston and Vienna.
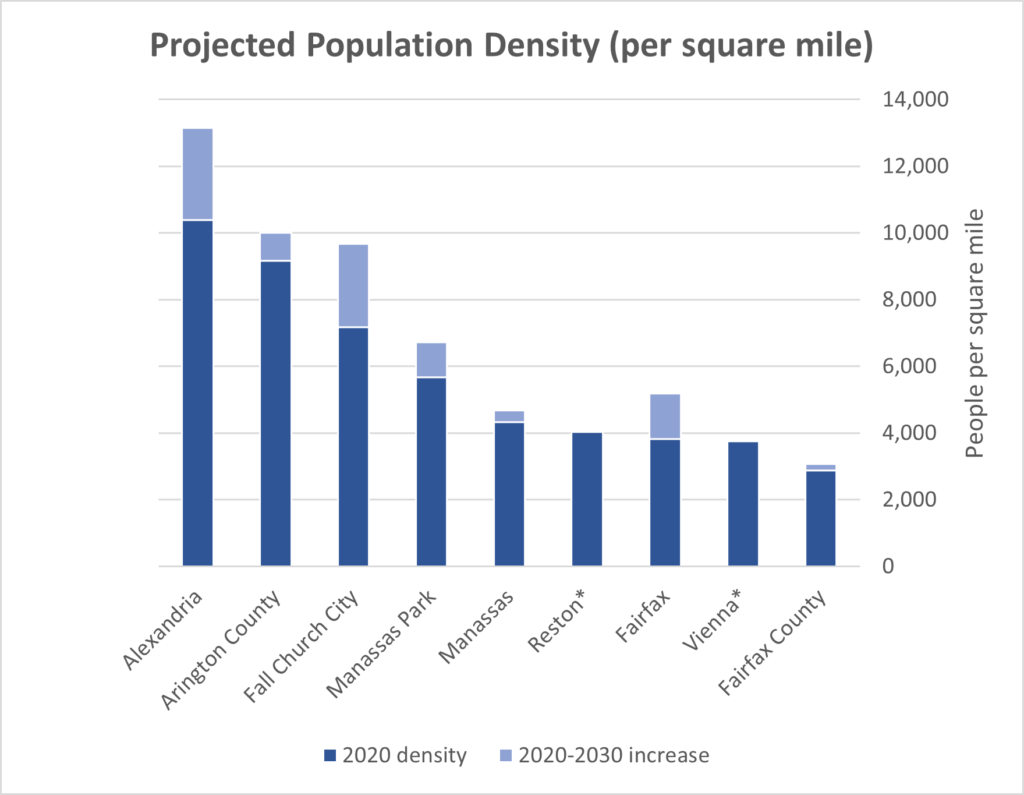
This graph shows that Falls Church City’s population density will almost match Arlington’s by 2030. The City of Fairfax currently has a population density a little over half that of Falls Church. Both cities have large housing projects, but Fairfax has more space to accommodate these projects. Even in 2020, Falls Church City was already at least 50% denser than Vienna, Reston, and Fairfax City.
Alexandria was the densest jurisdiction in 2020 and will continue to have the highest population density by a large margin. In November, 2023, Alexandria’s City Council voted to eliminate single-family zoning, allowing up to four units to be built on what was previously a single-family lot. Their action was reported in The Washington Post. Arlington also took steps to increase density in single family residential zones in March 2023.
Future trends – are we overbuilding?
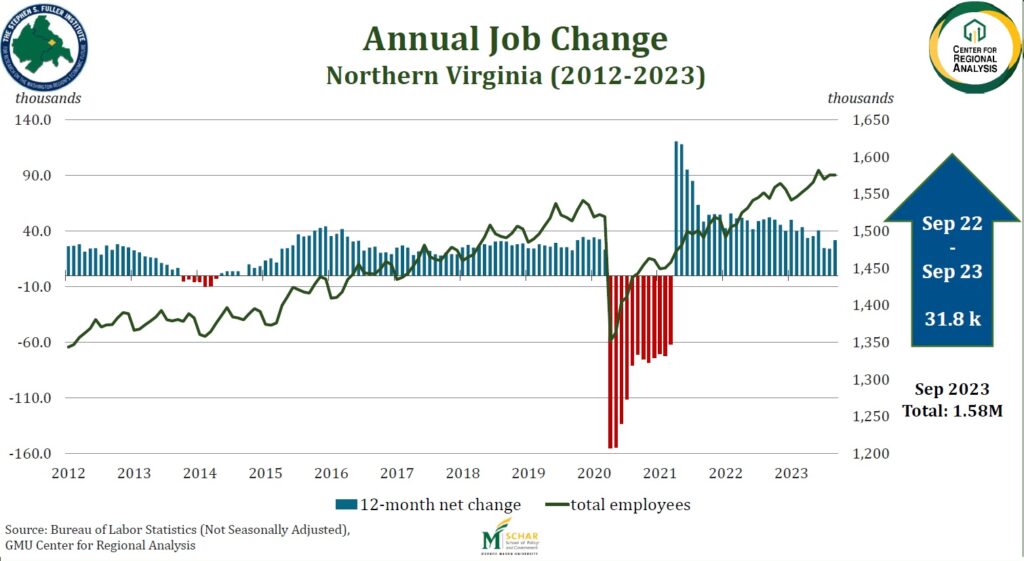
At the December 4, 2023, City Council/School Board joint work session, the SFI researchers also presented data on economic trends in the metropolitan Washington area. These trends show that the region has not been growing as fast as the rest of the country. If Falls Church reflects the regional trends, then the slowing economy will have an impact on the demand for housing.
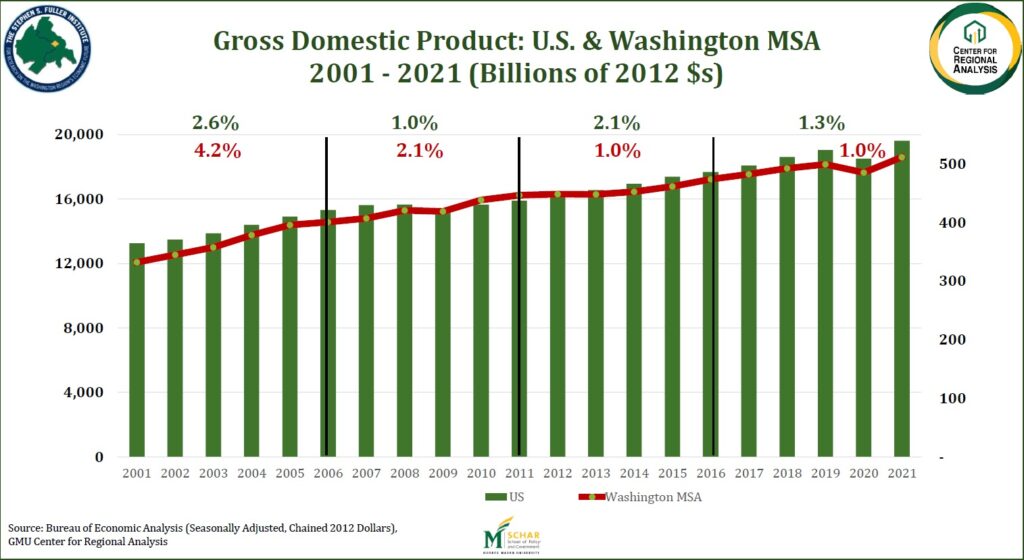
From the GDP data, growth in this region has lagged the rest of the country. The GDP has been growing in the metro area by 1% over the last 10 years. This is primarily due to a reduction in federal employment here that is expected to continue.
Although the picture in Northern Virginia is better, the slowdown in job creation is also apparent from the table below. Ms. Kiran Bawa, the Chief Financial Officer for the City of Falls Church, also spoke at the work session about the regional slowdown she has seen in her data. She said that in February 2023, there were 1.9 vacancies for every jobseeker but now there are 1.5 vacancies for each one.
The vast majority of the new housing units are rental apartments. The forecasts presume 85.8% occupancy rate for these rentals. A slowdown may result in lower occupancy rates. While the City is planning for a 35% increase in population growth by 2030, it is interesting that Arlington and Fairfax counties are only anticipating 9% and 7%, respectively. In fact, according to the SFI report:
“When population trends are examined for individual jurisdictions in the DC metro, Falls Church’s population stability falls in line with other “inner-core” suburbs, which saw either stagnant growth or decline from 2021 to 2022, chiefly due to domestic out-migration. Jurisdictions that gained population tend to be in the more exurban parts of the metro area, with large gains seen in areas just outside the smaller cities of Frederick and Fredericksburg, along with the more inner-core Fairfax City.” – Regional Trends Report
References:
- November 14, 2023, School Board Meeting, https://www.youtube.com/watch?v=ZDKSSEoLQXo&ab_channel=FallsChurchCityPublicSchools
- Round 10.0 Growth Trends To 2050: Cooperative Forecasting In Metropolitan Washington, October 2023, https://www.mwcog.org/file.aspx?D=yJtdNK%2fam%2bAlIbDboYtnhw%2fWDVW2MvP91LT50911BFw%3d&A=fKZUMEYdE1YnrDrNYUXbBnwhME%2fZRd3g%2bZ%2bdxajnc%2f8%3d
- Demographic Projections, Stephen Fuller Institute, https://go.boarddocs.com/vsba/fccpsva/Board.nsf/files/CXDUAG7A8BEF/$file/Demographic%20Projections_Final.pdf
- Student Per Dwelling Unit FY 2024, November 6, 2023, https://go.boarddocs.com/vsba/fccpsva/Board.nsf/files/CXKNGR5CDC03/$file/Student%20Per%20Dwelling%20Unit%20FY%202024%20as%20of%2011%206%202023.pdf
- Enrollment Projections Presentation, November 14, 2023, https://go.boarddocs.com/vsba/fccpsva/Board.nsf/files/CXEKYH538FF3/$file/Enrollment%20Projections%20Presentation%20November%2014%202023_SFI%20(1).pdf
- December 4, 2023, Joint School Board and City Council Work Session, https://fallschurch-va.granicus.com/player/clip/2501?view_id=2&redirect=true&h=165705dc395c28d4ad549071625a8919
- Presentation on Regional Trends & Demographic/Employment Forecasts City of Falls Church, T,L. Clower and K. Waters, Stephen Fuller Institute, December 2023, https://fallschurch-va.granicus.com/MetaViewer.php?view_id=2&clip_id=2501&meta_id=127974
- Regional Trends Report, https://fallschurch-va.granicus.com/MetaViewer.php?view_id=2&clip_id=2501&meta_id=127974
- In bid for more housing, Alexandria ends single-family-only zoning, The Washington Post, November 29, 2023, https://www.washingtonpost.com/dc-md-va/2023/11/29/alexandria-single-family-zoning-housing-vote/
- Missing Middle Opponents Doubt Zoning Change’s Impact On NoVA Sprawl, August 3, 2023, Patch.com, https://patch.com/virginia/arlington-va/missing-middle-opponents-doubt-zoning-changes-impact-nova-sprawl