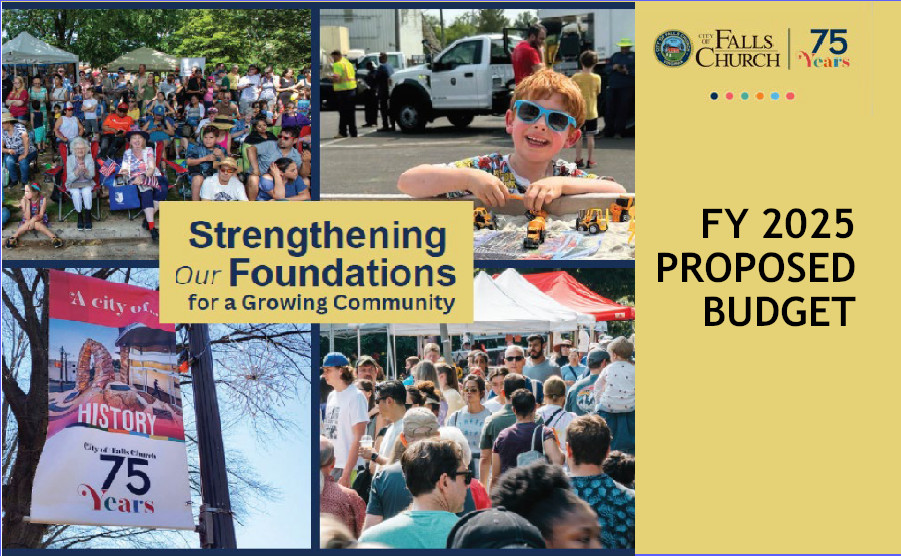
A Review of the Proposed FY 2025 Budget
Summary
The City Manager presented the proposed FY 2025 budget at the City Council work session on April 1, 2024.
- The total budget of $138.3 million represents a 16% increase over the 2024 budget.
- $11.8 million will be transferred to the Capital Fund and the Special Transportation Projects Fund to support capital improvement projects in 2025.
- City and school employees will receive a 6% pay increase. The equivalent of 16 full-time equivalent employees (FTE) will be added to the general government (City Hall) and seven to the public schools.
- Real estate taxes are expected to increase 2.4% after a 1-cent reduction in the tax rate from $1.23 to $1.22 per $100 of assessed value of real estate. Assessments have increased 3.2% on average.
- Sewer usage and stormwater rates will increase 3.6%. The availability fees paid by developers for new connections to the sewer system will increase by 10%.
- Risks include delays in completion of new construction, WMATA State grants being lower and sales, meals and other tax projections falling short.
The budget documents include the 6-year plan for the City’s Capital Improvement Program (CIP). This post does not go into the CIP except to highlight the transfer of funds to support the 2025 CIP projects. The CIP can be found here, The Capital Improvement Program (CIP) 2025 and Beyond .
Budget accuracy and risk
All items in the budget are forecasts with varying degrees of risk. For example, real estate taxes might be more easily projected as the assessments are performed in January before the budget is formulated. Sales taxes and meals taxes, however, are largely dependent on the economy and are more difficult to forecast.
On the expense side, there is some ability to adjust expenses based on actual revenues received during the budget period. However, much of the City’s expenses involve employee salaries and benefits, so that there is limited wiggle room for existing employees.
Therefore, in reviewing the City budget, it is also important to consider the riskiness of the projected numbers. The City has not provided data on the accuracy of their past forecasts or whether the current forecasts are conservative or optimistic.
The proposed FY 2025 budget
A simple way to look at the finances of the City is to view all money coming to the City as going into one of many funds, e.g. School Fund, General Fund, Sewer Fund, Stormwater Fund. Each fund has its own budget. This post is concerned with the budget of the General Fund that covers the expenses of the general government under the City Manager. A quick tutorial on the City budgets can be found in the addendum at the end of this post.
The proposed FY 2025 budget begins on July 1, 2024, and ends June 30, 2025. The overall budget is $138.3 million. The chart below shows the revenues and expenses in this budget.
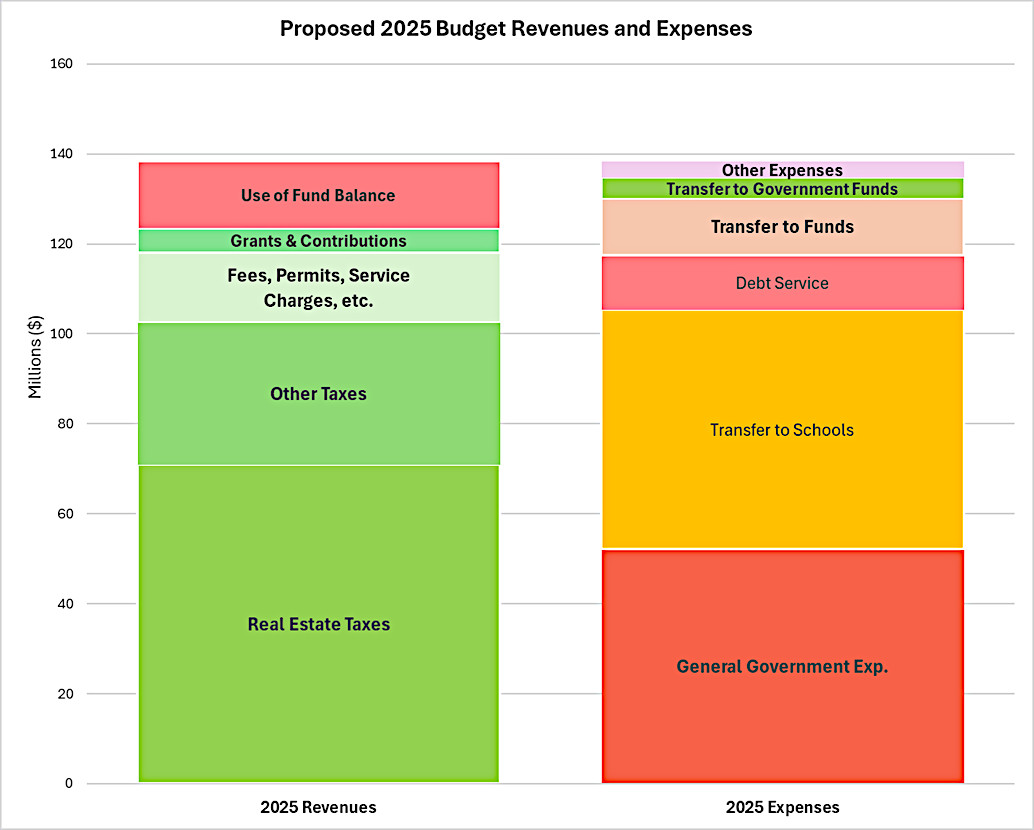
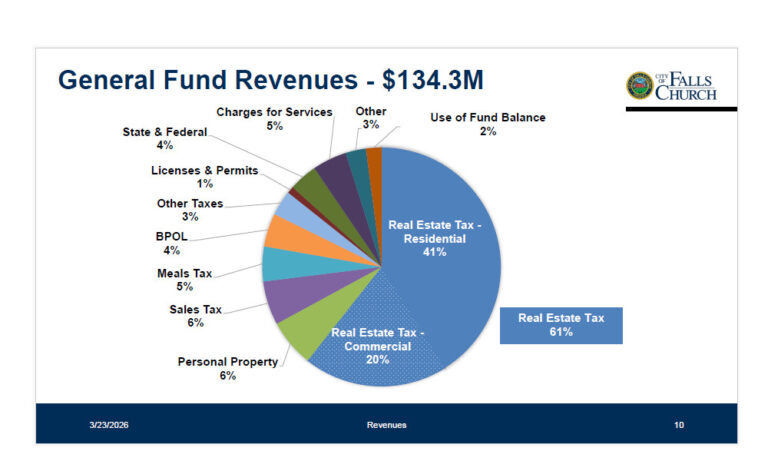
2025 revenues
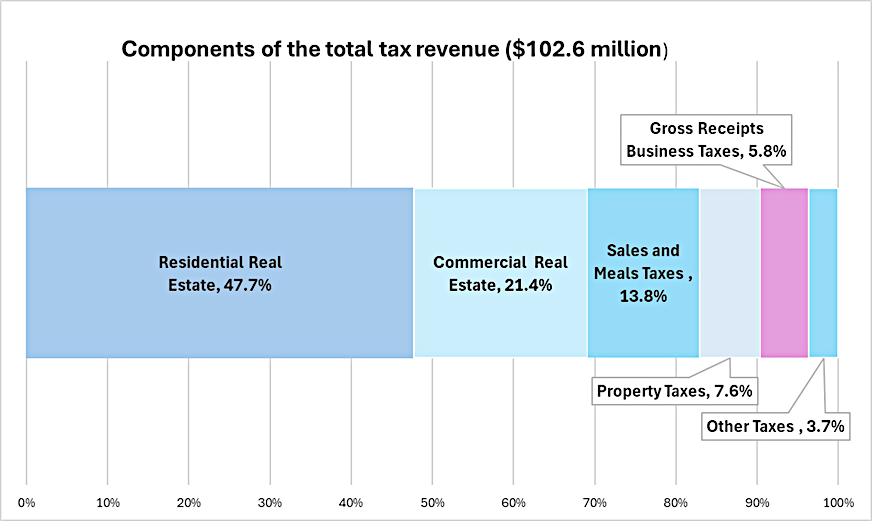
All taxes to be collected comprise 74% of the total revenue expected in this budget. Real estate taxes comprise about 51% of the total revenue (35% residential and 16% commercial real estate taxes). The expected ratio of residential to commercial real estate taxes is 69:31. This ratio has not changed much over the last 5 years.
Real estate taxes are anticipated to increase 7.3% over 2024, even with the real estate tax rate being reduced from $1.23 to $1.22 per $100 of assessed value. This projection is based on real estate assessments on January 1, 2024, and expected completions of new developments at Broad and Washington, Founders Row II, and West Falls.
However, at the April 8 City Council meeting, there was discussion that the possibility that State funding for Washington Metropolitan Area Transit Authority (WMATA) may be much reduced. City Manager Wyatt Shields asked for a first reading of a $1.24 real estate tax rate to allow flexibility, but Councilmembers were strongly opposed. A first reading of the $1.22 rate passed unanimously.
Sales tax and meals taxes make up 11% of the total revenue. Property, business, and other taxes make up 12%. These non-real estate taxes are expected to grow 12.9%, including a projected 8.7% increase in property tax, 27.5% increase in meals tax, and 7% increase in sales tax. These projections have a higher risk of uncertainty.
The graph below shows the makeup of the $102.6 million (74% of the budget) of total taxes that are anticipated in this budget.
City fees, licenses, permits, service charges, and other non-tax receipts are 11% of the budget.
Expected Federal and State grants amount to 4% of the budget. Current negotiations in Richmond, especially on WMATA subsidies, will affect the State grants.
This budget includes a $15 million withdrawal (11% of budget) from the City’s general government funds capital (Use of Fund Balance).
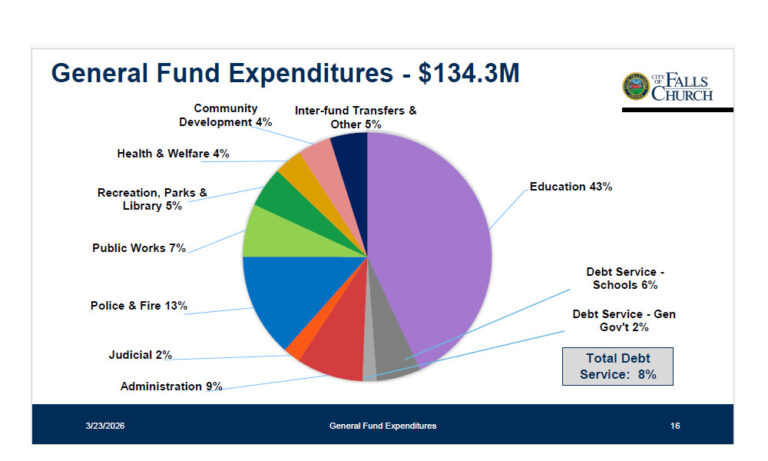
2025 expenses
Much of the City’s expenses go toward salaries for staff. As an employee may be part-time or have their time split between departments, staffing is measured as full-time equivalents (FTE). One FTE is the equivalent to the cost of one full-time employee.
General government expenses
This year, the increase in total general government expenses makes it and the education expense almost the same. Each is 38% of the total budget. This expense of $52.2 million is an increase of 8.8% over 2024. This increase is higher than the 7.9% reported in the City Manager’s message in the proposed budget document because the latter omitted some one-time costs that were not itemized in the document. For transparency and to compare budgets across the years, we totaled the spending of each department as stated in the document.
15 additional FTE, 6% salary increases, benefits, and higher training costs are included in this budget.
Public Safety will add three new police officers and two new 911 dispatchers to address current shift deficits and the increase in call volume. A “unsworn” position will also be added. More additions are expected in future budgets. Including these six new positions, a total of 59.35 FTE is funded for Public Safety, a 9.7% increase in expenses compared to FY 2024.
The reorganization of the City Manager’s office added two deputy City Managers. To manage the many CIP projects, the Public Works department will add four FTE. (1 additional engineer is included in the Sewer budget, which is not a part of this budget.) Public Works has the largest expense increase of all departments – 13.95% compared to 2024. Human Resources, Finance, Information Technology, and the Library will increase by one FTE each. The Planning department will reduce headcount by one FTE. The City also contracts out work that cannot be done in-house. The City’s Professional and Contractual expenses total $14.3 million, 27.4% of the general government expenses. This is a 3.9% increase from 2024.
Transfer to schools
The amount requested by the School Board increased by 7.1% from 2024. FCCPS budgeted for an additional seven FTEs and a 6% pay raise as well. Please refer to the FCCPS website for more information.
Debt service
The debt service of $12.2 million, 9% of the budget, is for the principal and interest due on bonds issued. At the end of FY 2023, the City had debt totaling $168 million. More than three-fourths of the debt service is related to FCCPS, the bulk of it for the construction of Meridian High School. The remaining debt includes bonds for the library and City Hall renovations.
Note that this debt service does not include the sewer and stormwater enterprises’ debt services. Those are accounted for separately. The City anticipates issuing between $14 million and $20 million in debt between 2025-2028 to pay for new sewer infrastructure and additional capacity. Also, the City expects to issue $30 million in debt in FY 2028 to replace the Robert Goff Operations Center, also known as the Property Yard.
Transfers to funds
A total of $11.8 million will be transferred to the CIP Fund and the Special Transportation Fund to support capital expenses planned for the 2025 fiscal year. This spending is described in the CIP and realizes many of the City’s strategic goals, read The Capital Improvement Program (CIP) 2025 and Beyond. the 2025 CIP projects include:
- Public Safety capital outlays, including replacement of radios – $2.4 million
- Community Center heating and air conditioning (HVAC) – $2.9 million
- Recreation and Parks – $1.1 million
- Traffic signals – $1.4 million
- Upgrades to the Meridian High School stadium – $600,000 for a concession stand, press box, and restrooms
- Replacement of the synthetic turf at Meridian High School – $850,000
Funds are also transferred to the Affordable Housing Fund ($500,000), FCCTV ($254,588), and the EDA ($27,209).
Transfer to government funds
Anticipated ground lease payments from the West Falls development of $4.68 million will be placed in the general government funds to help service the bonds issued for the construction of Meridian High School.
Other expenses
$1.5 million of the $2.1 million in real estate taxes to be received from the West Falls development will be credited back to the West Falls developers as part of a City agreement. The Economic Development Incentive Agreement is for six years from FY 2023 to FY 2028.
The WMATA annual cost is $1 million more than for 2024. The WMATA cost of $2.6 million in this budget assumes that the State will provide additional grants towards WMATA in the State budget. Governor Glenn Youngkin has opposed funding for WMATA. Without State funding, this cost will be higher.
Longitudinal comparison of the proposed 2025 budget
We provide a longitudinal comparison of the proposed 2025 budget to the budgets from 2021 to 2024 for additional context. The budgets for 2021 to 2023 are actual data, while 2024 is the budget that was proposed and adopted in 2023.
General government expenses vs. education expenses
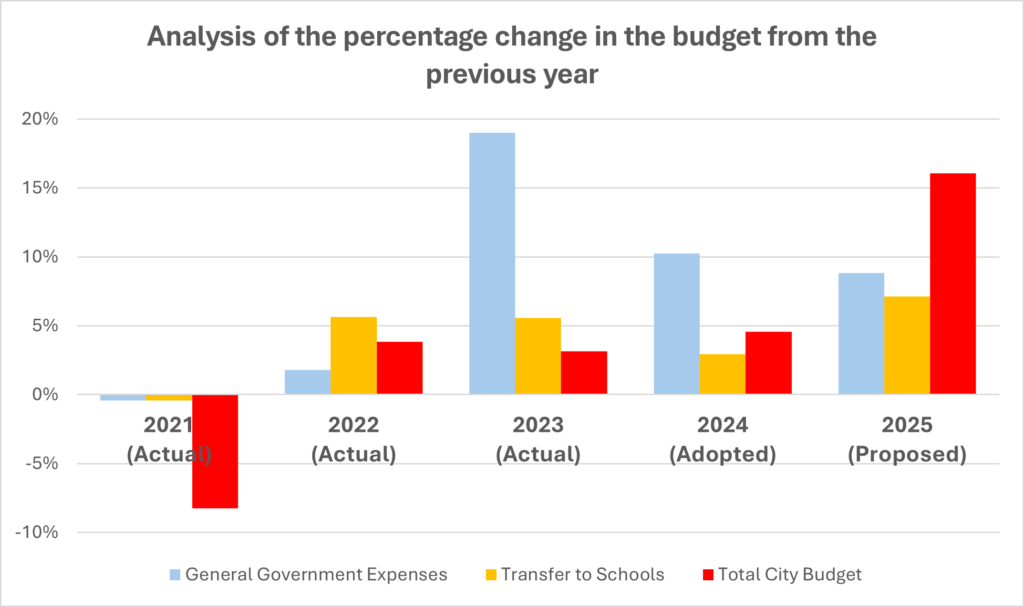
The City tightened spending in 2021 in response to COVID and the pandemic’s impacts on the economy. In 2023, with the boom in real estate prices, revenues also came in higher, and the City was able to make up for this belt tightening. City Hall departments that had cut spending more than the schools were able to give employees raises again. General government expenses saw a 19% increase from the previous year, although the total budget increased by only 3%. 2024 expenses reflected the high inflation and increase in wages (6%) for the City to be a competitive employer. Staffing also increased.
The graph below compares the increase or decrease in general government expenses and expenses for the schools for each of these budget years.
More employees
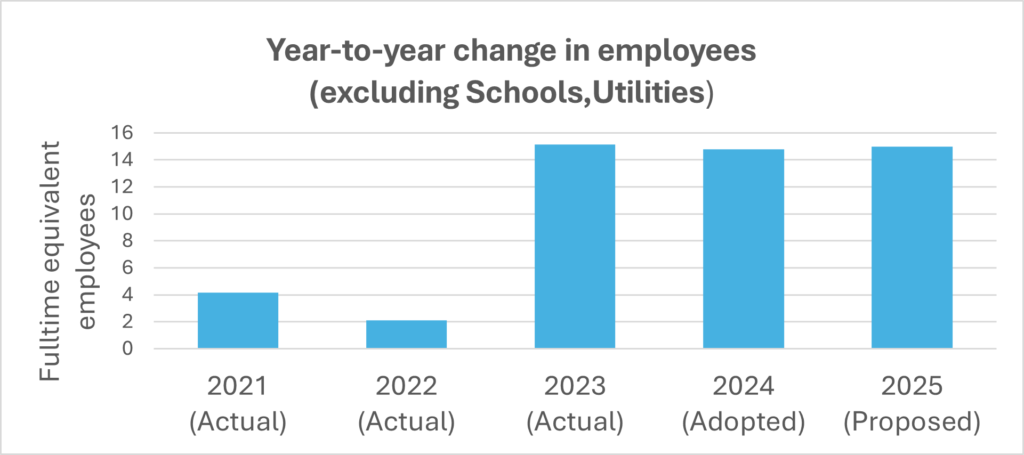
City Hall employees totaled 212.8 FTEs in 2021 and will increase to 259.8 in 2025. City Hall, renovated in 2020, is now over-full and the City is looking to lease office space, read The Capital Improvement Program (CIP) 2025 and Beyond. This growth in staffing corresponds to the increased population from major developments. (Read Falls Church Demographics: The Impacts of Growth.)
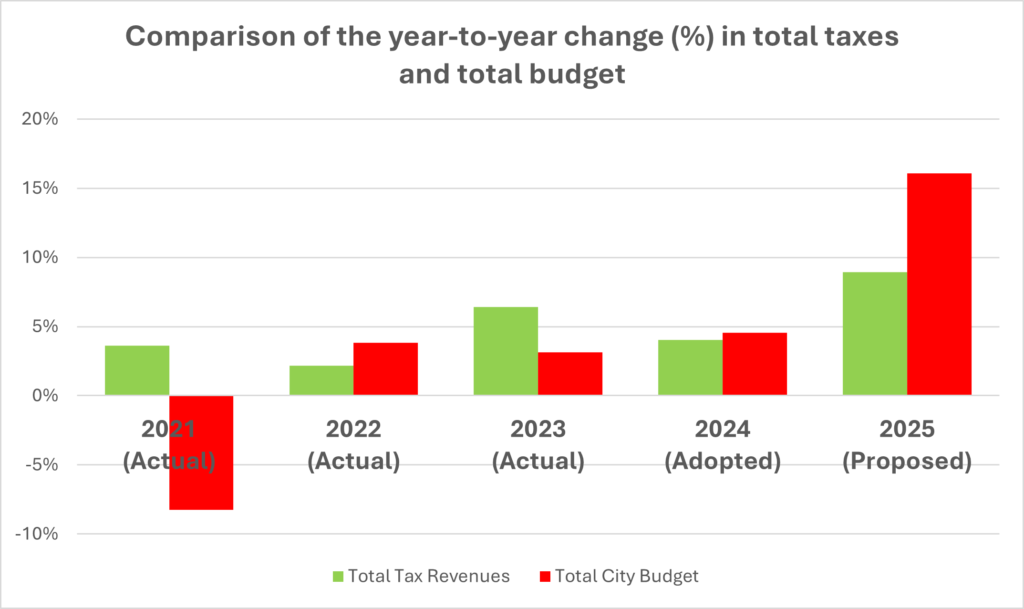
Changes in tax revenues
The main source of revenue for the City is from taxes. For 2025, taxes are expected to provide 74% of the revenue. Between 2021 and 2025, taxes were between 74% and 79% of the budget revenue. A comparison of the percentage change in the total taxes collected from the previous year with the percentage change in the City budgets provides a rough look at how the budget size changed in relation to revenues. This is shown in the graph below.
The COVID effect on real estate taxes
We know that during COVID home valuations increased substantially while commercial property values were depressed. Due to City tax rate changes and varying assessments of commercial properties and different forms of real estate, there are not easily available data on the net effect on individual taxpayers. We present the year-to-year real estate tax changes for a representative single-family house in Falls Church and a commercial property, Kensington Senior Living, below. The 2024 assessment on the house is $1.1 million and the Kensington is $26.3 million.
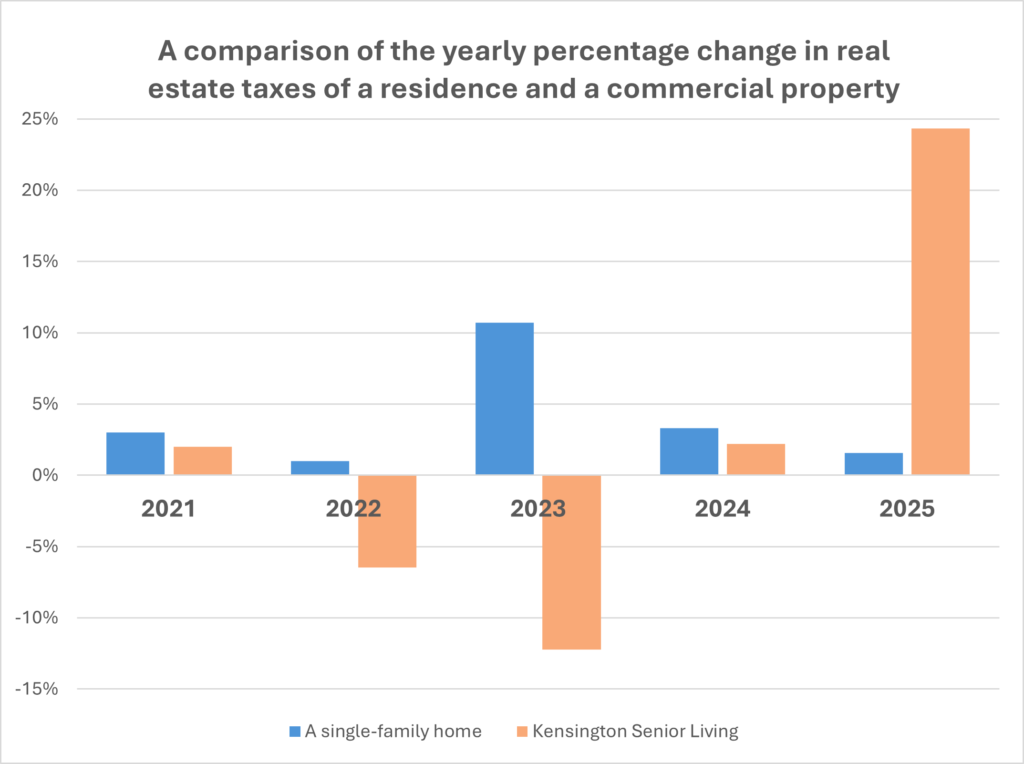
In 2024, the house assessment increased 2.4% while the Kensington assessment increased 25.4%. (This surprisingly brings the Kensington back to just below its 2018 assessment.) The budget proposes that the tax rate be lowered to $1.22 from $1.23 per $100 of assessed value of real estate. This would result in a 1.6% increase for 2025 for this house and a 24.3% increase for the Kensington. The City expects an average 2.4% real estate tax increase for homeowners.
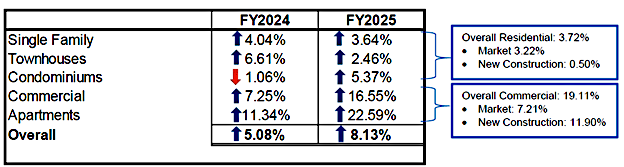
The 2025 budget anticipates an increase of 7.3% in total real estate taxes based on the total assessment value on January 1, 2024. From the table below, the increase in assessment values is quite large for commercial and apartment buildings, though much of this comes from new construction.
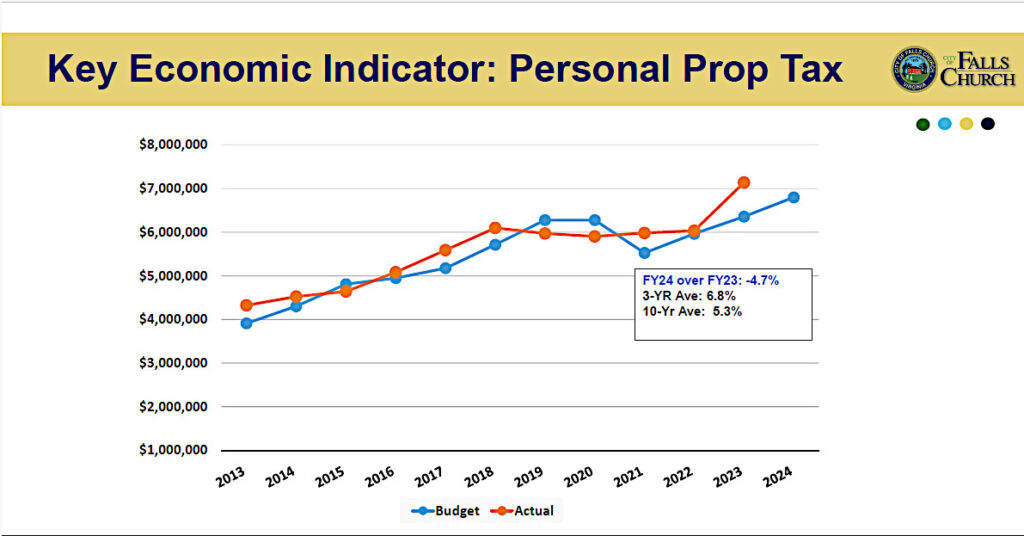
The COVID effect on property taxes
How many of us felt an initial relief that we were not shopping for a car during COVID only to find that our property tax on the old jalopy in our driveway had jumped? It resulted in a property tax bonus for the City. The property tax rate is unchanged in 2025, but a 15% decrease in the valuation of used vehicles is expected. Here are the data:
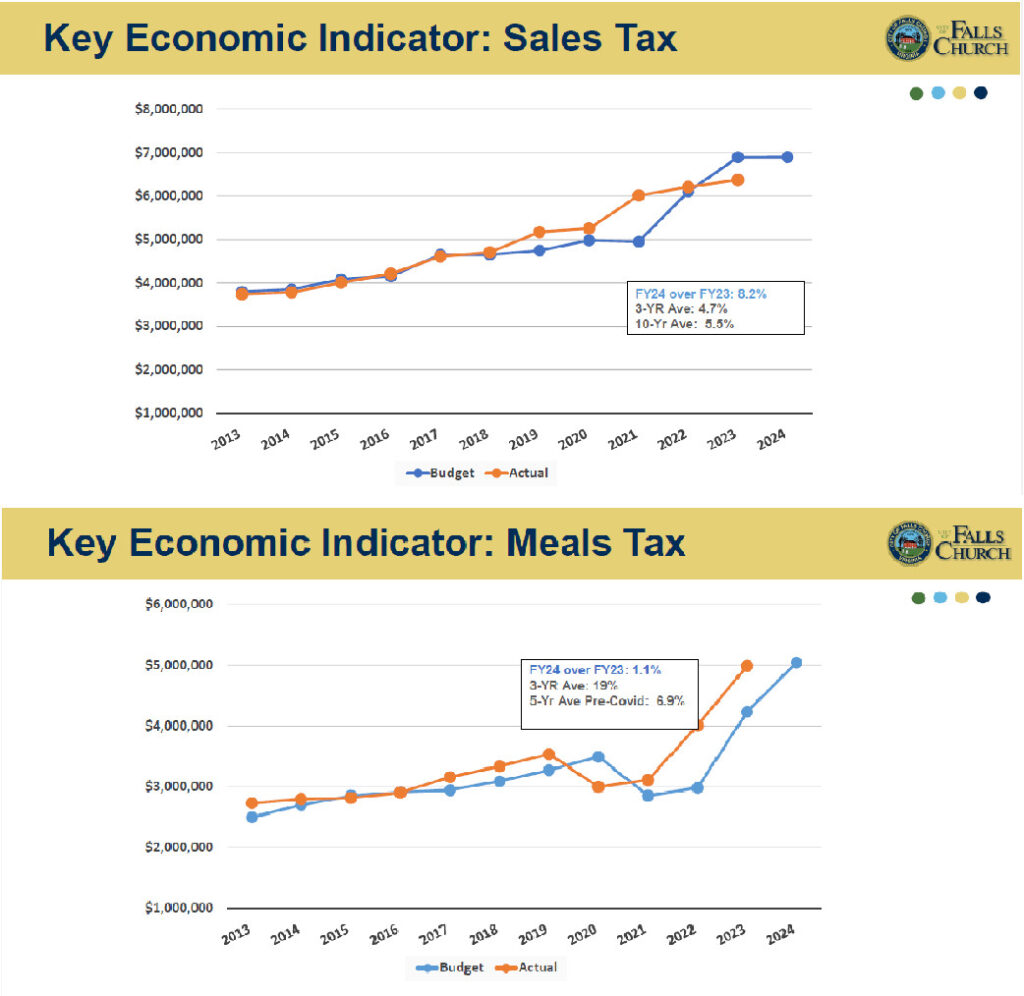
Sales and meals taxes Fortunately, the hard work of City businesses to adapt during COVID enabled sales and meals taxes to recover quickly. Increasing sales and meals taxes shows that the City’s businesses help to diversify the tax base.
The budget schedule
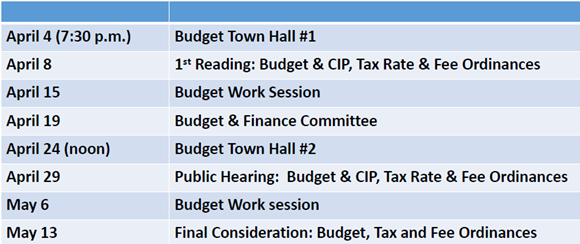
The schedule above shows the meetings that have been scheduled on this budget. A town hall was held on April 4, and a second one is scheduled for April 24 with a public hearing slated for April 29. The final budget will be voted on by the City Council on May 13. The budget is scheduled to go into effect on July 1, 2024.
References
- City Council Work Session, April 1, 2024. This video will not display properly on a small screen because it includes the agenda.
- PowerPoint Presentation Slides (PDF, 30 pages) Proposed 2025 budget presentation by the City Manager, Wyatt Shields, April 1, 2024.
- Proposed 2025 Budget (PDF, 310 pages)
- City Council meeting, April 8, 2024. YouTube video.
- City Council meeting, April 8. 2024. This video will not display properly on a small screen as it includes the agenda document.
- Fiscal Year 2022 Adopted Budget
- Fiscal Year 2023 Adopted Budget
- Fiscal Year 2024 Adopted Budget
- Fiscal Year 2023 Annual Financial Report
- FY2024 Budget Amendment – Carryforwards. October 2, 2023. This document contains presentation slides with historical data on budget items.
A quick tutorial on the City budgets
The City finances are organized into three categories of funds: (Funds are similar to financial accounts.)
- General Government:
- General Fund – main government fund
- Capital Improvement Program (CIP) Fund – for long-term projects
- Special Transportation Fund – for transportation projects
- Affordable Housing Fund – to support affordable housing initiatives
- FCCTV Fund – cable TV
- Components:
- Falls Church City Public Schools (FCCPS) Fund
- Economic Development Authority (EDA) Fund
- West Falls Community Development Authority (CDA) Fund – to separately account for bonds issued and costs for the West Falls infrastructure.
- Enterprises (Utilities)
- Sewer Fund
- Stormwater Fund
Each of these funds has an annual budget. The City Manager has responsibility for the funds and budgets in the General Government and Enterprises Funds. The Sewer and Stormwater enterprises have their own revenue sources and are self-financing. The City Manager’s budgets must be approved by the City Council to be adopted.
The School Board sets the budget for FCCPS and requests a transfer from the General Fund to cover their budget. Similarly, the EDA has authority over the EDA Fund and budget and the CDA over the CDA Fund and budget.
This post is concerned with the first category – General Government, and more specifically the General Fund budget. This essentially covers all of City Hall. For the purposes of this post, we will refer to this as the City budget or the budget. The CIP budget will be discussed in a separate post. Because of the sewer challenges facing the City, the Sewer budget will also be discussed in a separate post. The remaining funds under the City Manager are straightforward and will not be discussed in-depth.
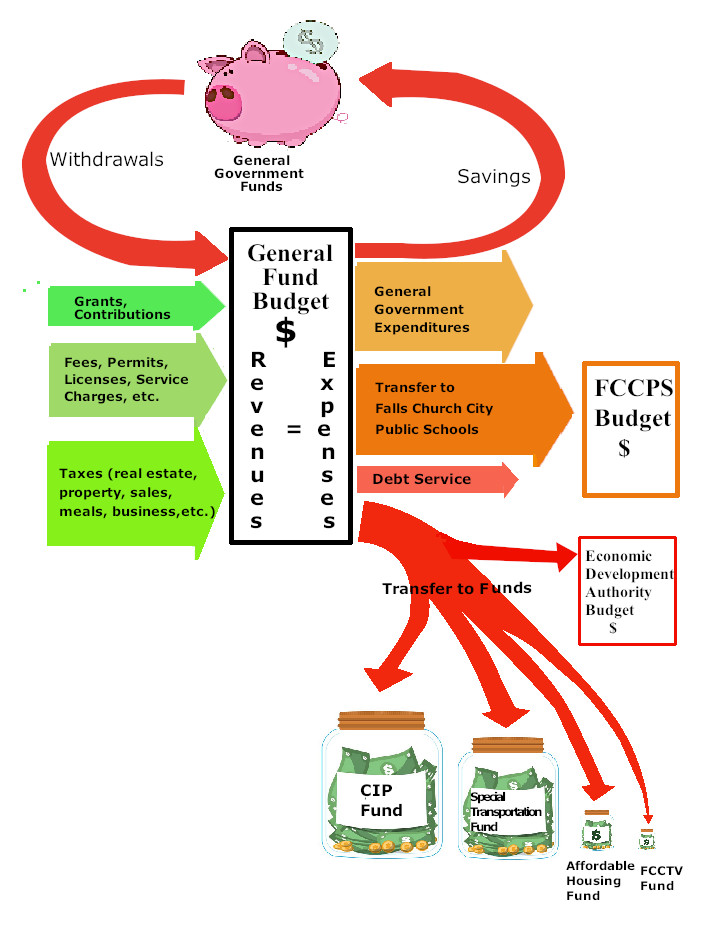
The City budget and fiscal year begins July 1 and ends June 30. The figure above is a high-level conceptual view of the elements of the General Fund budget. In the budget, revenues must equal expenses. Any shortfall in revenues is covered by a withdrawal from general government funds, the City’s “savings accounts.” Any excess revenues, and sometimes required deposits, are put back into those savings accounts.
Revenues
Most City revenues are generated by taxes that include real estate taxes, property taxes, sales and meals taxes, and business taxes. The City also collects revenues from licensing, fees, permits, and other service charges.
State and federal grants form a small but important category of revenues. Voluntary contributions from developers are also part of the City’s income. Grants and contributions typically have designated requirements for how they must be spent, e.g., stormwater, parks, affordable housing, etc.
Expenses
The general government expenditures cover the running costs of all the departments in City Hall under the City Manager. They include the library and public safety.
The other large expense category is funds designated for education, all but a small amount of which is transferred to the FCCPS for their budget.
Debt service refers to the principal and interest payments required on the City’s bonds and debts.
Other fund transfers are to the:
- Capital Fund for capital improvement projects,
- Special Transportation Fund for infrastructure projects,
- Affordable Housing Fund to support its programs, and
- FCCTV fund, a small account to support the City’s cable TV channel.
The fund transfers can vary greatly from year to year, depending on the projects that are being undertaken and the timing of funds needed.