Single-Family Homeowners Bear the Cost of the City’s Growth
Summary
The City has grown dramatically over the last decade, the result of a persistent strategy by successive City administrations. Falls Church has new restaurants, shops, and major housing developments. Accommodating this growth has required investments by the City, funded largely by increased property taxes paid predominantly by the owners of single-family homes, including townhomes (SFH).
From FY2020 to FY2026, taxes on the median single-family homeowners grew 21.8%, while the median condominium owner’s taxes increased 11.5%. As for the newer apartments that account for most of the recent growth in the City, the average taxes per apartment increased only 4.5%. This outcome begs the question: Is growth paying a fair share of the costs of growth?
“Growth should pay for growth”
A November 18, 2025 Pulse post describes the City’s growth from 2013 to 2025. Growth requires investment. Infrastructure such as roads and sewer transport and stormwater drainage systems all have to be built or expanded. Services such as schools and libraries need to accommodate a larger population. City staff including planners, inspectors, and project managers have to be hired. Investment requires funds; in this City, financial resources are generated by local taxes, concessions from developers, bonds, and grants from federal and state entities.
The City’s mantra has been that “growth should (and does) pay for growth.” This assertion anticipates that the City’s tax revenues will rise because of the new housing and commercial spaces being built, and that the additional revenues they generate will pay for the costs of growth. However, our analysis indicates that this common refrain is inaccurate. To date, property taxes – primarily from single-family homes and townhouses – have enabled the last decade of growth.
Our analysis looks at how the City has raised funds to pay for growth. As always, City staff and the local government’s website have been invaluable sources of data, especially data from past budgets and the Falls Church real estate assessment database. This analysis focuses on 12 years from Fiscal Year 2014 (FY2014) to FY2026. FY2014 began on July 1, 2013, with July 1 the starting point for each fiscal year. Financial data for FY2025 and FY2026 are budget estimates, while data for earlier years are actual revenues and expenditures.
The cost of growth
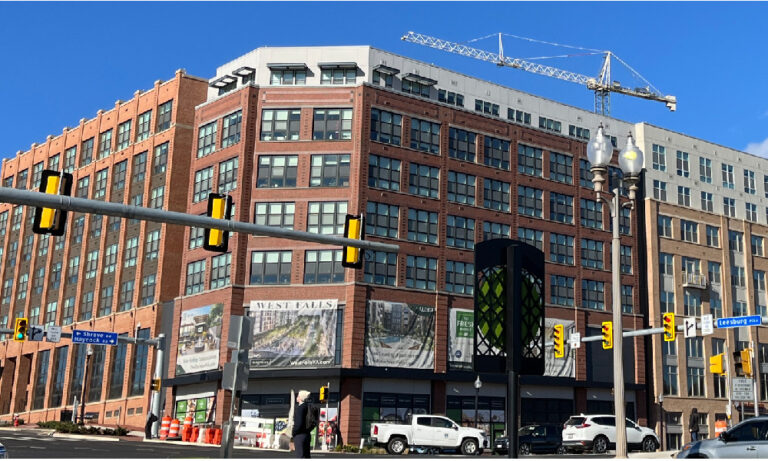
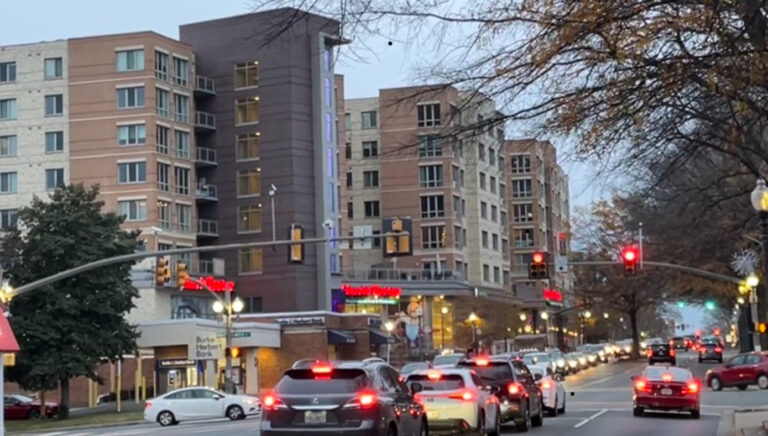
The City’s road, stormwater, and sewage infrastructure were constructed decades ago before the first mixed-use development – the Broadway Condominiums – opened on Broad Street in 2004. The City had less than 5,000 households then. The infrastructure was not sized to accommodate the 7,495 households of today, with an additional 280 units just completed in Modera Founders Row and more to come. The City has also had to provide facilities for its own larger workforce, which has expanded to support the growth itself and the necessary services for its many more households and students.
For example, accommodating the West Falls development required the City to spend $10.5 million to enlarge the sewer lines and bring a sewer line to the site. The City is also negotiating with Fairfax County to increase its sewage processing capacity with an estimated cost of $45 million over the next six years. Neighborhoods have asked the City to install speedhumps, bump-outs, and other traffic calming facilities to address increased traffic. Broad Street and N Washington Street have traffic lights and pedestrian crossing lights every few hundred feet. The schools, library, and City Hall have been expanded or replaced with larger facilities. Though just renovated in 2019, City Hall has already run out of space for staff. [See the Pulse post Growth Drives the City’s Proposed Utilities/Facilities Plan, October 13, 2025.]
Aging infrastructure will eventually need replacing. Some argue these costs would have been incurred regardless of growth. However, each project undertaken today expands the required capacity of what was there before, either to accommodate growth or in anticipation of growth. Stormwater pipes that could be re-lined to extend their use now have to be replaced with larger conduits to handle heavier run-offs with the consequent loss of mature trees and pervious land, ultimately a much costlier undertaking.
A growing City budget
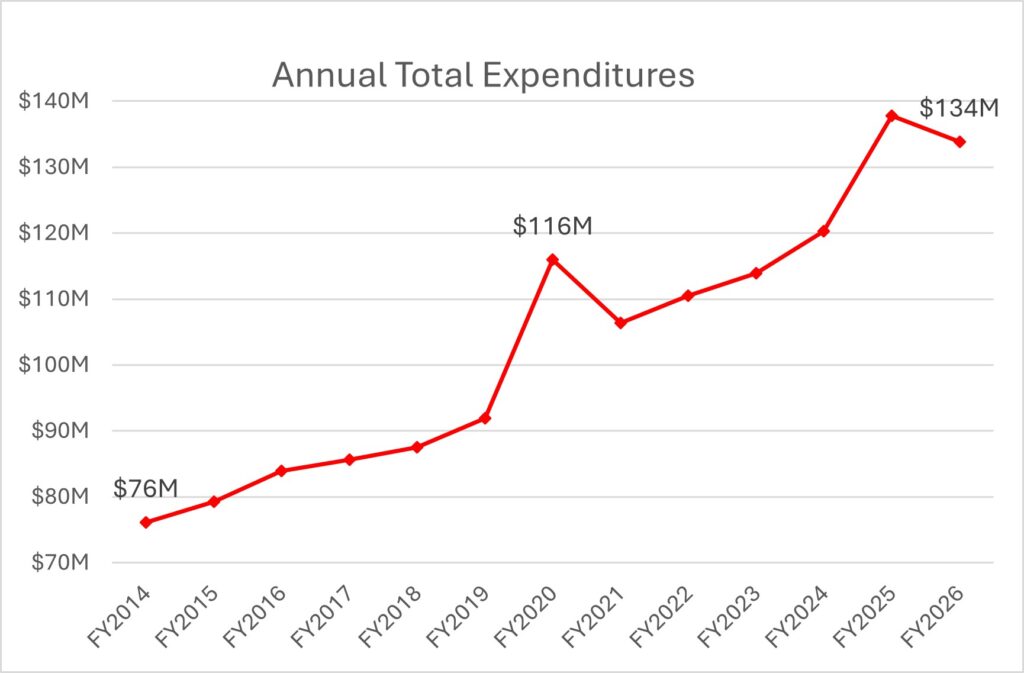
The fiscal cost of accommodating the City’s growth is reflected in the annual City budgets. Each budget’s expenditures represent the cost of running the City and upgrading its infrastructure. The graph below shows that the City’s total expenditures grew 76% from FY2014 to FY2026, averaging almost 5% a year. The spikes in FY2020 and FY2025 were caused by spending on capital improvement projects.
Some of the increase was due to inflation and infrastructure work, but the City staff size increased from 185 full-time equivalents (FTE) in FY2014 to 252 FTEs in FY2026, a 36% increase.
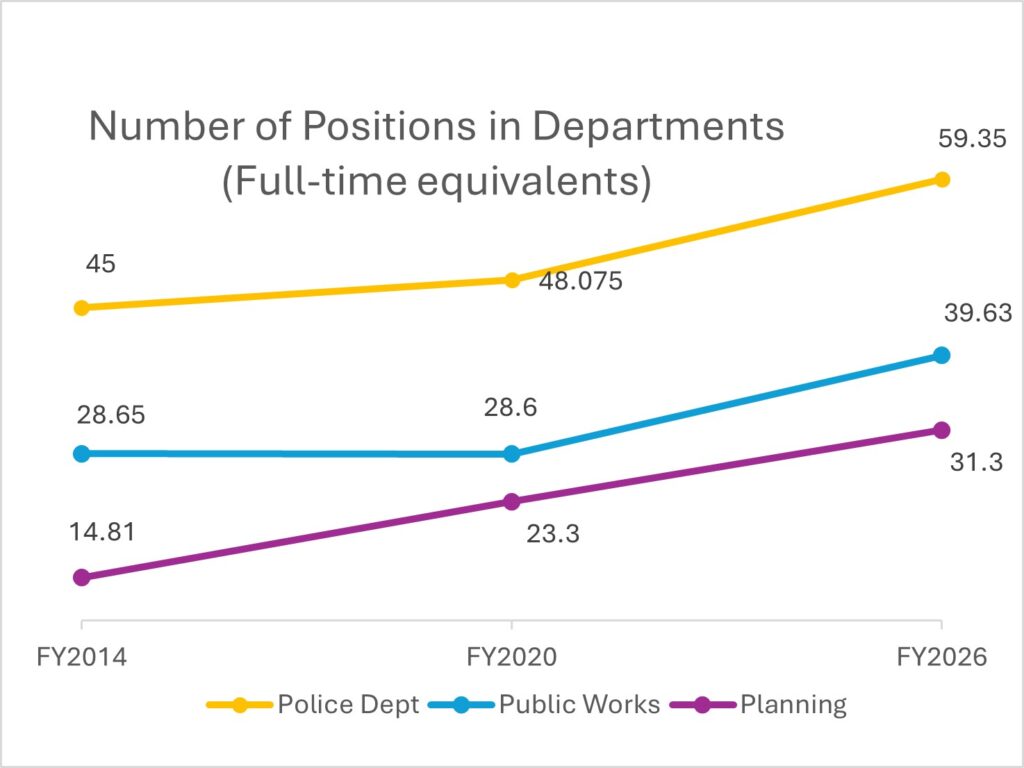
The graph below shows that the Planning department that is responsible for responding to development proposals doubled in size during this period. The Public Works Department (DPW) increased by 39% in the last six years as more engineers and project managers were added to oversee the upgrade of City infrastructure. The City’s larger population required the Police Department to add 30% more staffing.
Paying for growth
When the City negotiates with the developers of a mixed-use development, the terms of the deal, called “Voluntary Concessions,” cover some of the costs of growth. For example, Founders Row agreed to put in a bus stop and traffic lights, as well as three speed humps on Grove Avenue. The developer also agreed to contribute about $1.5 million to school capital costs.
The City sold the Falls Church Water utility to Fairfax County for a net return of $14 million in 2014. The land lease for West Falls brought in $34.5 million. State and federal funds provide partial support for some projects, mostly transportation related.
For large capital costs, the City issues bonds. At the end of FY2014, the City had an outstanding bond debt of $60 million. By the end of FY2024, the debt had grown to $164 million. The new high school involved a $120 million bond issue in 2019. The City expects to issue more bonds for needed sewer infrastructure and a new property yard at Gordon Road.
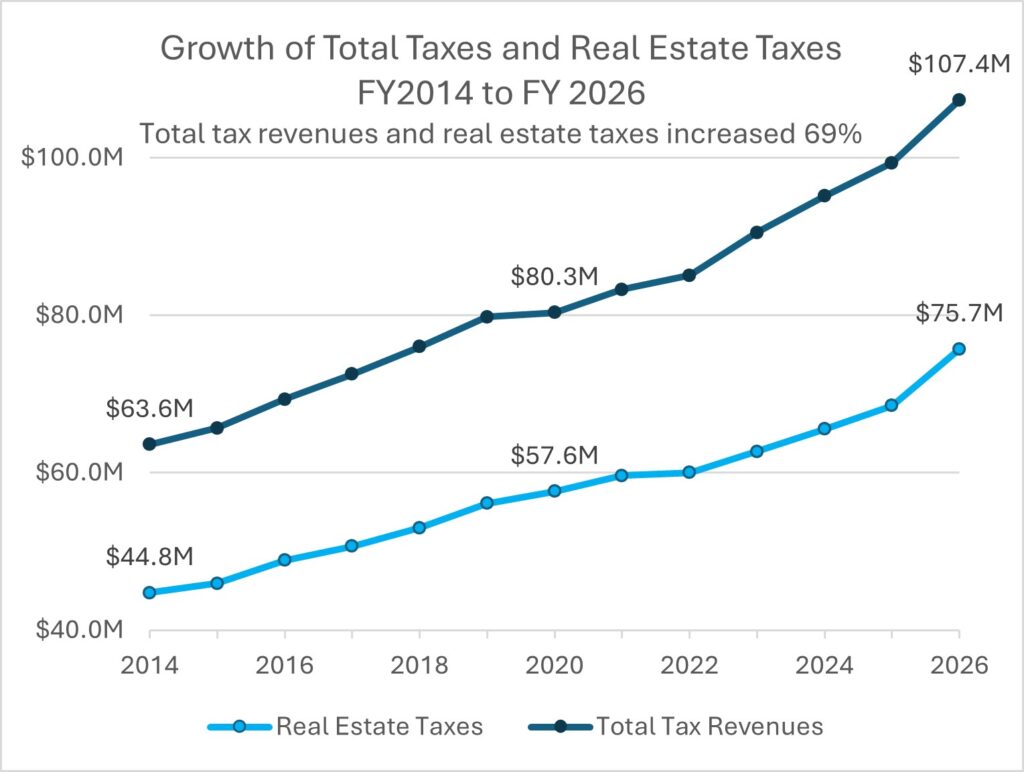
The main source of funds for the City to grow and to repay the bonds comes from local taxes – real estate taxes, sales taxes, meals taxes, business taxes, personal property tax for cars, and so on. From FY2014 to FY2026, total tax revenues grew 69% to support the expansion of the City’s budget. The biggest local tax category, real estate taxes, also increased 69%.
Real estate tax revenues are the one source of revenue for the City that can be predicted with great accuracy and reliance. The real estate taxes in any given fiscal year are based on the assessments of the prior year. For example, FY2014 real estate taxes are based on the 2013 real estate assessments. The real estate tax rates are set to bring in precisely the amount of revenue required for a balanced budget.
Sources of tax revenues in the City
The City added 1,987 housing units between 2013 (FY2014) and 2025 (FY2026); 1,813 of these units were apartments in six mixed-use developments. These new developments entered the City’s real estate tax base in the years they were completed:
- Northgate (2014, 104 units),
- 301 W Broad and Tinner Hill Apartments (2016, 509 units),
- Founders Row (2021, 466 units),
- Broad and Washington (2024, 334 units), and
- West Falls (2025, 400 units).
As the graph above shows, even as the City’s non-real estate tax revenues grew from new restaurants and stores in these developments, they were insufficient to offset the real estate tax revenues needed. Real estate tax revenues each year made up 69%-72% of total tax revenues. The graph below shows the composition of taxes for FY2014, FY2020, and FY2026. FY2026 are estimates.
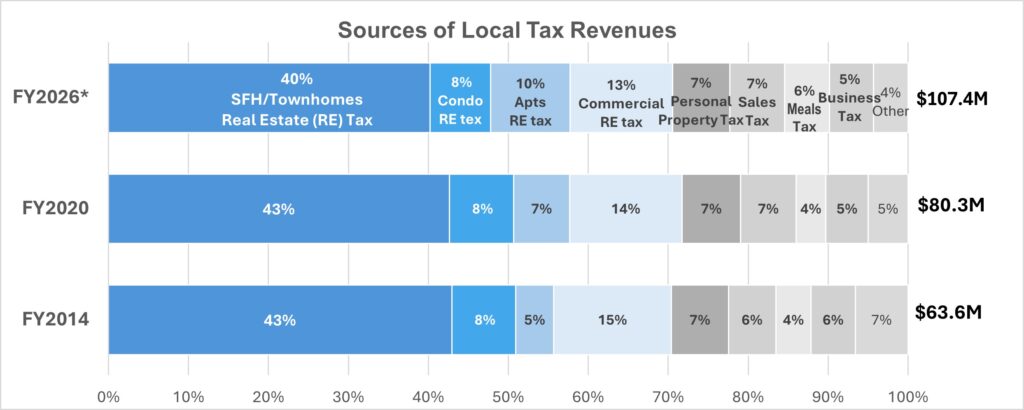
Some of the increase in real estate taxes came from new developments. Adding 125% more apartments in the City helped double the share of taxes paid by apartment owners from 5% in FY2014 to 10% today. The 125 Oak condominiums at West Falls and 10 Railroad Cottages raised the taxes from condominium owners between FY2014 and FY2026, helping to maintain their share as taxes grew.
Single-family homeowners (SFH), a category that includes townhomes, were the largest group of taxpayers every year. Their share of City real estate taxes was about 43% until FY2024 and then fell slightly. While there was some new construction, these homeowners maintained their share primarily because of a hot real estate market that increased the values of their properties.
Conversely, the devaluation of commercial properties during COVID led to a reduction in the share of taxes paid by commercial property owners.
Single-family homeowners are paying the most for growth
The real estate tax burden is apportioned according to assessed values. In this region, the housing market has surged over the past 12 years, affecting assessment values in turn. The graph below compares the growth in assessed values of different types of real estate properties by standardizing their values to their 2019 assessments.
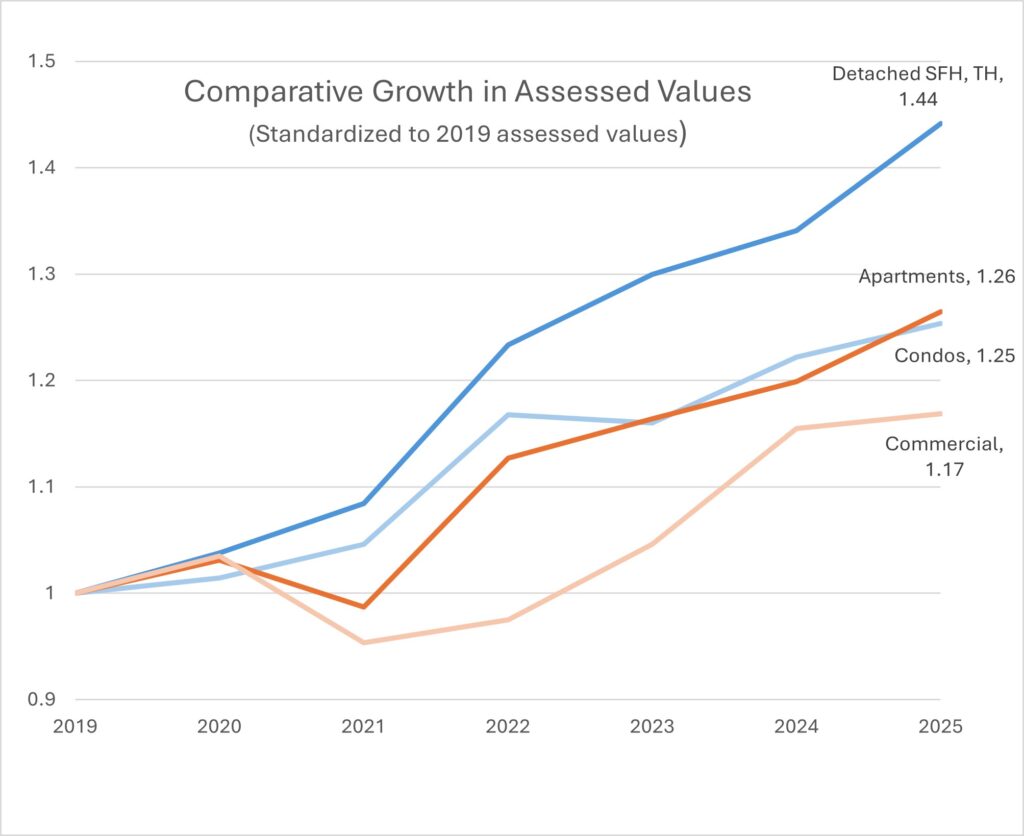
Since 2019, single-family home assessments increased 44%. (The growth captures some rebuilding and major renovations, but a sample of homes that did not undergo major renovations experienced similar assessment growth.) Meantime, apartments and condominium assessments grew 26% and 25%, respectively, while commercial real estate grew 17%.
The housing tax burden
To understand the tax burden on individual households over the last 12 years, the Pulse compared the taxes paid according to the housing type as shown in the graph below. We computed the taxes on the median SFH using data provided in the City’s annual budgets. Taxes on the median condominium are derived using the assessment database. (Note that the Read and Person Square buildings are condominiums in the real estate database even though their units are all rented out as if they were apartments.)
For households in apartment buildings, we averaged the apartment taxes over the number of units. We distinguished between those apartments that may have undergone minor renovations since 2013 and newer apartments that were built or underwent major renovations between 2013 and 2018 as part of the recent growth in the City. (Founders Row (2021) and later developments were omitted as their data did not cover the entire period of interest.) The pre-2013 apartments were all built prior to 2000. No apartments were built between 2000 and 2013. The post-2013 apartments are located at:
- Falls Green, major renovations completed in 2018
- Northgate (2014)
- 301 W Broad (2016)
- Tinner Hill (2016)
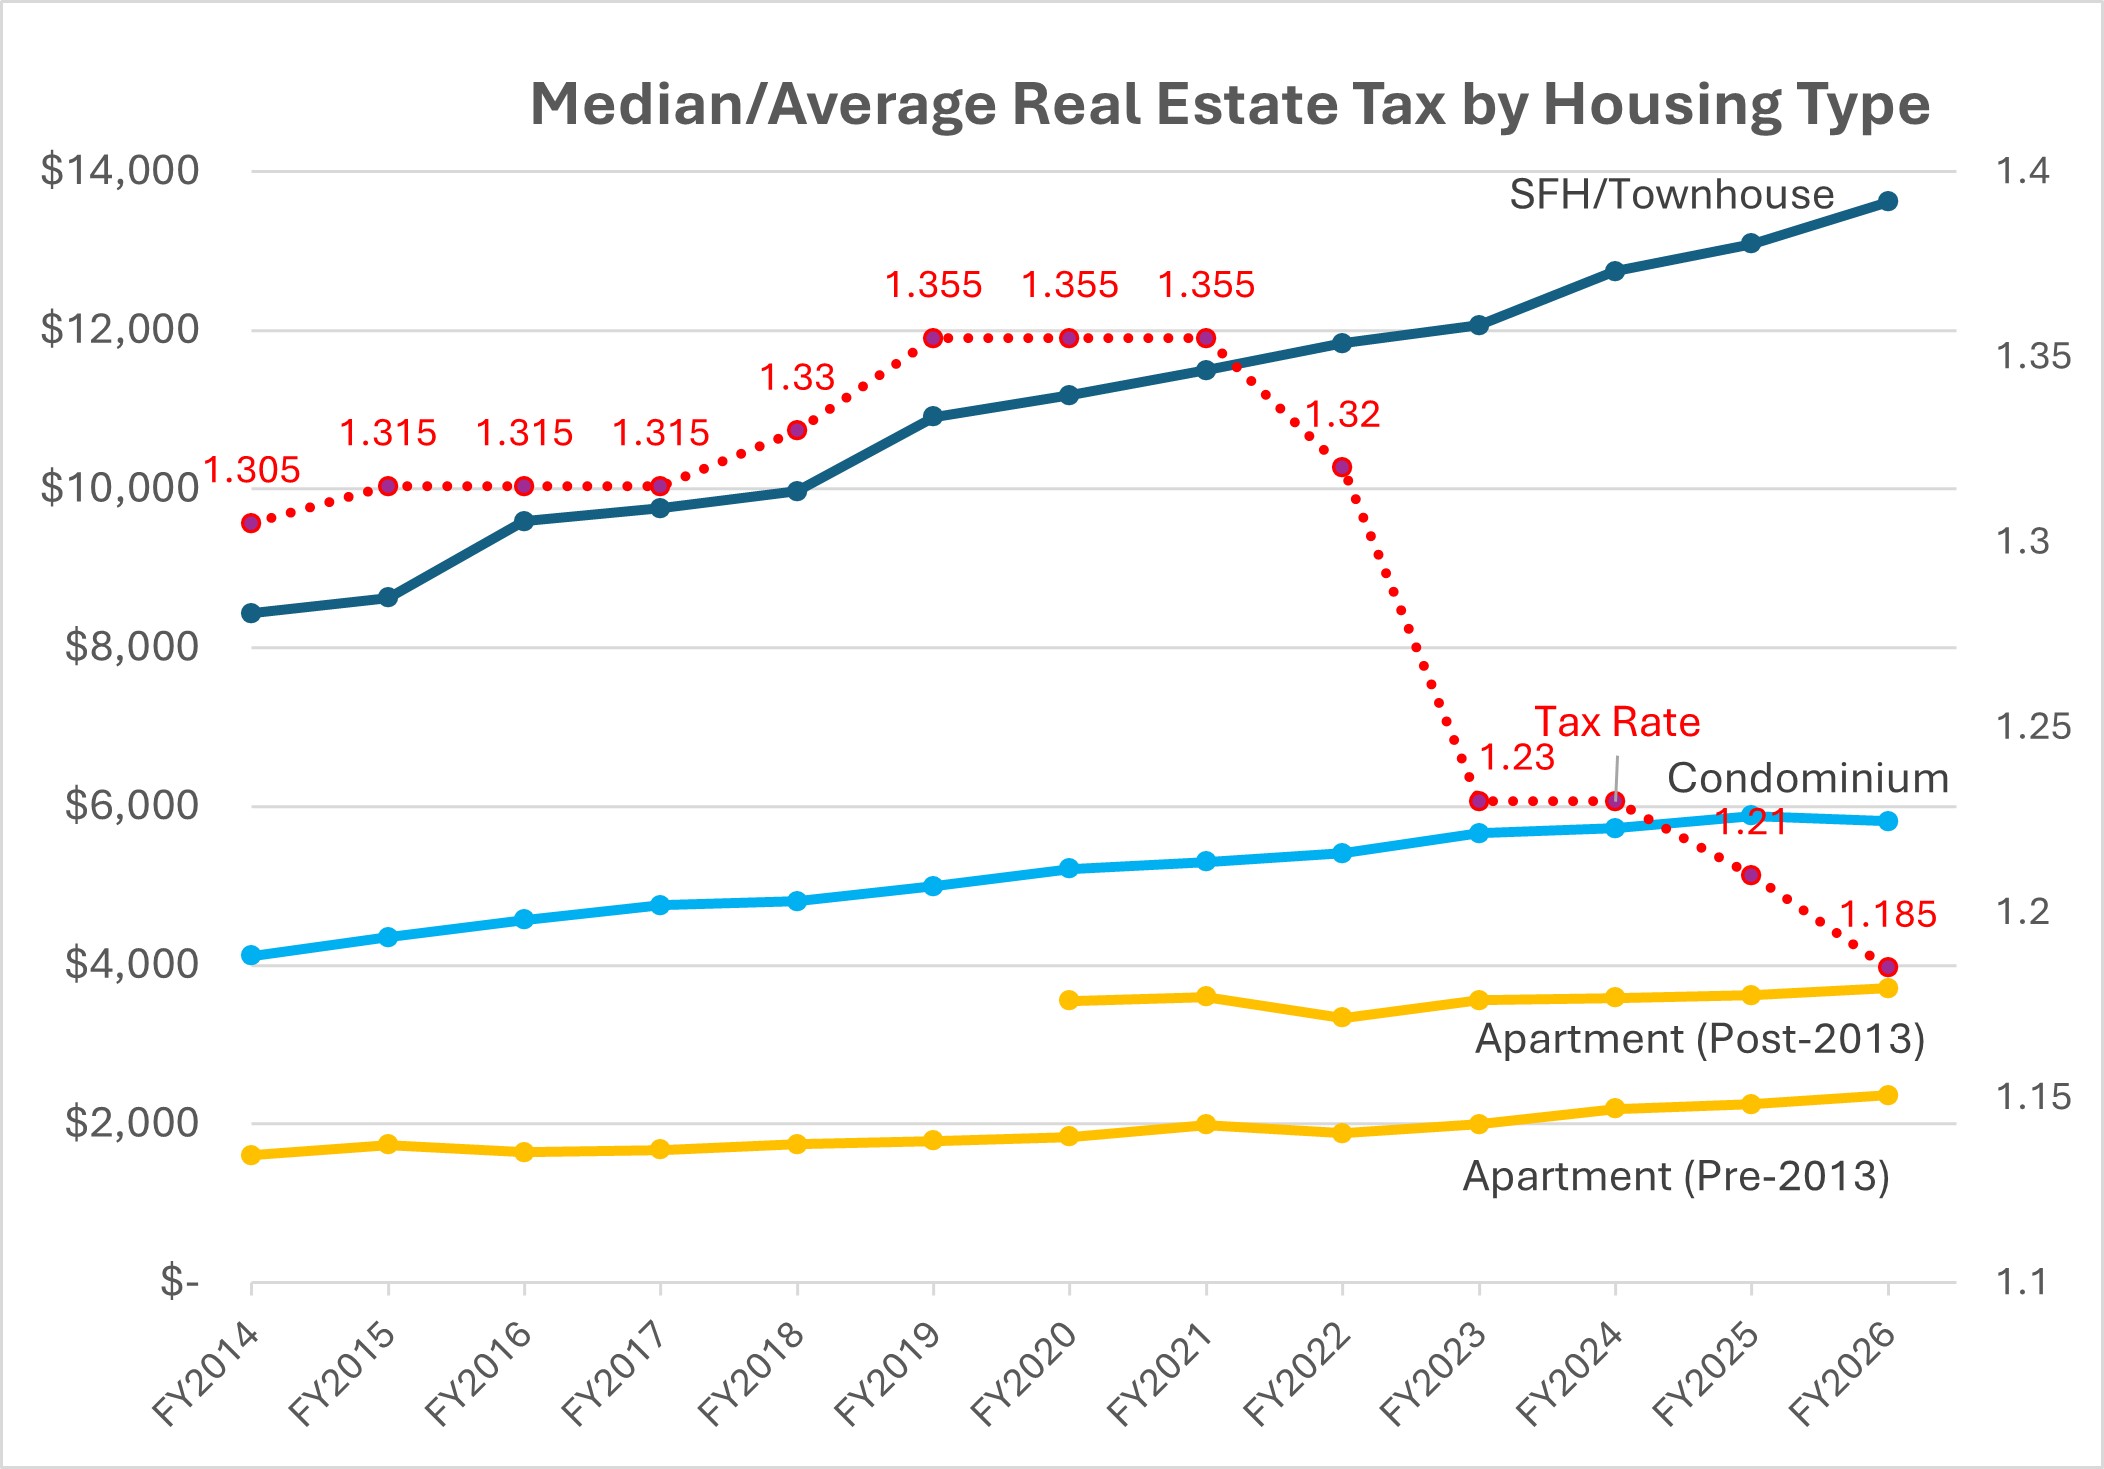
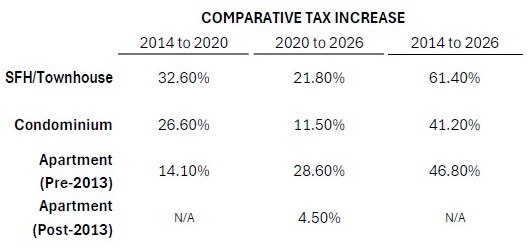
Despite the falling tax rate, the median single-family homeowner experienced a whopping 61.4% increase in real estate taxes over 12 years due to increasing assessments. Condominium owners experienced a lower increase of 41.2%. The median household income for Falls Church City increased only 23% from 2014 to 2023.
The average pre-2013 apartment showed a 46.8% increase that was likely reflected in rent increases. Some of this increase was due to renovations that increased assessed values.
For the post-2013 apartment developments, we limited the analysis to the period from FY2020 to FY2026. This was to allow at least two years for these developments to reach stable occupancy. Before this period, their assessed values were only a fraction of their full potential. Over these six years, the taxes per apartment unit only went up 4.5%. Other taxpayers had double-digit increases during the same period. This result begs the question: Are the new developments paying their fair share of the cost of growth they have brought to the City?
Determining the assessed value of a property
The real estate tax due on a property is based on its assessed value as determined by the City Assessor. State law requires that properties be assessed at 100% of their fair market value, and the Virginia Department of Taxation conducts annual reviews of the assessments that look at the assessed value-to-sales ratio (ASR) of properties sold in each jurisdiction. In 2023, the City’s median ASR ratio was 89% for 115 residential properties sold, i.e. half the properties were assessed below 89% of the sales price, half above. The median ASR for the five commercial properties sold that year was 100%. Properties are reassessed every year to bring the assessments in line with fair market value based on the latest sales data.
For Falls Church City, there are so few sales in each neighborhood that each one can have a profound impact when used to benchmark assessed values. Especially for detached single-family houses, a sale of one or two houses can affect the assessments of all the houses in that neighborhood.
The fair market valuation of apartment buildings and commercial properties is determined very differently. Sales are few and far between. Properties are so distinct as not to be comparable. Furthermore, corporate owners of large apartment buildings have the resources to bring in consultants to contest City assessments with far greater success than homeowners submitting do-it-yourself appeals. From FY2020 to FY2026, the assessment value of post-2013 apartments increased 19%, compared to the 44% increase in SFH assessment value.
References
- Students by Dwelling Place, Stephen Fuller Institute analysis of FCCPS Student enrollment, October 31, 2024. Presented at the City Council work session of December 2, 2024. This document enumerates the housing units in the City.
- Resident Population in Falls Church city, VA (VAFALL0POP) | FRED | St. Louis Fed.
- Falls Church City Budget webpage. Budget archives and past financial reports are available here.
- City of Falls Church, Virginia Real Property Search – actDataScout. Assessment data. A subset of this database can be obtained as a datafile from the City Assessor for a fee.
- Census Data Warns of Housing Market Bubble in 2025, Housing.info, September 16, 2025. Discusses the disparity between income and housing costs.